Learning Journey
Free preview · Lesson 1
Understanding Comparing Data on Graphs
Comparing Data on Graphs: Unlocking the Stories Numbers Tell!
Hello, young data detectives! Have you ever looked at a picture or a chart and tried to understand what it's telling you? That's what we do when we compare data on graphs! It's like finding clues to solve a mystery about numbers.
What is Data? (It's Easier Than You Think!)
Imagine you count how many apples, bananas, and oranges are in a fruit bowl. Those counts – like 5 apples, 3 bananas, and 2 oranges – are called data. Data is just information, usually numbers, that we collect about something.
Think of it like collecting your favorite stickers. Each sticker is a piece of data about what you like!
What are Graphs? (Pictures That Tell Number Stories!)
Now, how do we show our data so it's easy to understand? We use graphs! A graph is like a special picture that helps us see numbers and information quickly. Instead of just a list of numbers, a graph makes it visual.
Imagine trying to tell your friend how many toys everyone in your class has by just listing numbers. It would be confusing! But if you draw a picture showing tall towers for lots of toys and short towers for a few, it's much clearer. That's what graphs do!
Why Do We Compare Data? (Finding Out 'More,' 'Less,' and 'Same'!)
Comparing data means looking at two or more pieces of information and seeing how they are similar or different. It's like comparing the height of two friends – who is taller? Who is shorter? Are they the same height?
When we compare data on graphs, we ask questions like:
- Which group has more?
- Which group has less?
- Are any groups the same?
- What is the difference between two groups? (How many more or how many less?)
- What is the total if we put groups together?
Let's Meet Our Graph Friends!
1. Bar Graphs: Tall Towers of Information!
Bar graphs use bars (like tall rectangles) to show amounts. The taller the bar, the more of something there is. The shorter the bar, the less there is.
Analogy: Think of bar graphs like stacks of blocks. If you have a tall stack of red blocks and a short stack of blue blocks, you can easily see you have more red blocks than blue blocks! That's comparing!
When you see a bar graph, look at the height of the bars. To compare, just find the bars you want to look at and see which one reaches higher or lower on the number line (called the 'axis').
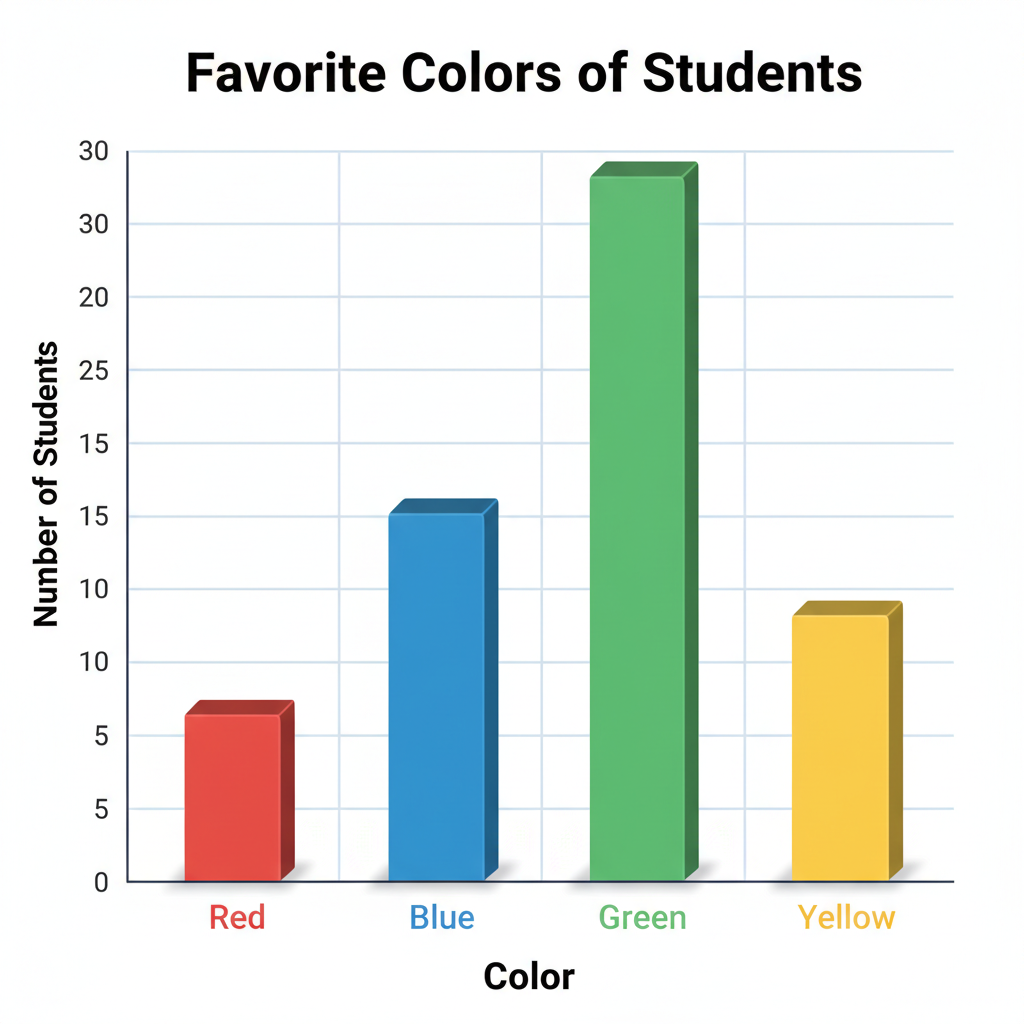
How to Compare on a Bar Graph:
- Find 'More': Look for the tallest bar. That's the one with the most!
- Find 'Less': Look for the shortest bar. That's the one with the least!
- Find the 'Difference': If you want to know how many more blue toys there are than red toys, find the number for blue toys and the number for red toys. Then, subtract the smaller number from the larger number. (Example: 8 blue toys - 5 red toys = 3 more blue toys).
- Find the 'Total': If you want to know how many toys in total, add the numbers for all the bars together!
2. Pictographs: Pictures That Count!
Pictographs use little pictures or symbols to show data. Each picture usually stands for a certain number of items. There's always a 'key' that tells you what one picture means.
Analogy: Imagine a sticker chart where each star sticker means you did 2 chores. If one person has 3 stars and another has 5 stars, you can count by twos to see who did more chores (3 stars = 6 chores, 5 stars = 10 chores). The key is super important!
How to Compare on a Pictograph:
- Check the Key: Always, always, always look at the key first! It tells you what each picture is worth. If the key says 'one apple = 5 students,' then each apple drawing means 5 students.
- Count Carefully: Count the number of pictures for each category. Then, multiply that count by what the key says each picture is worth.
- Compare the Numbers: Once you have the total number for each category (after using the key), you can compare them just like you would with a bar graph. Who has more? Who has less? What's the difference?
3. Line Plots: Dots on a Line!
Line plots show how often something happens along a number line. They usually use X's or dots to mark how many times a value appears.
Analogy: Think of a line plot like measuring how many pencils are different lengths. You line up all the pencils, and for each length, you put an 'X' above that number on a measuring tape. If there are more 'X's above 6 inches than above 7 inches, it means you have more 6-inch pencils.
How to Compare on a Line Plot:
- Look at the 'X's: For each number on the line, count how many 'X's are stacked above it. More 'X's means that value happened more often.
- Find the Most/Least: The number with the tallest stack of 'X's is the most frequent. The number with the fewest 'X's (or no 'X's) is the least frequent.
- Compare Stacks: To compare two specific numbers, just compare the height of their 'X' stacks. Which one is taller?
Putting it All Together: Be a Data Detective!
No matter which type of graph you're looking at, the goal is the same: to understand the story the numbers are telling you. When you compare data, you're asking important questions and finding the answers right there in the pictures!
So next time you see a graph, don't just look at it – compare the information! You'll be amazed at how much you can learn.
Keep learning, free
Create a free Syllabax account to unlock practice questions and games for this topic.
Visual Learning Enhanced! 🚀
To help you master this topic, we use Advanced Syllabax AI to generate detailed diagrams and visual models.
Note on Visuals: The AI sometimes makes spelling errors in image labels. Please refer to the lesson text for the correct terminology.