Calculating Mean from Frequency Tables
Watch this topic in 60 seconds
Free preview · Lesson 1
Understanding Calculating Mean from Frequency Tables
Understanding the Mean from Frequency Tables: A Foundational Guide (Grade 10)
Welcome, 10th-grade learners! Today, we're going to unlock a super useful skill in statistics: calculating the mean (or average) when your data is organized in something called a 'frequency table'. Don't worry if those words sound a bit fancy; we'll break everything down into simple terms, using lots of everyday examples and analogies.
What is the Mean, Anyway? (The "Fair Share" Concept)
Let's start with the basics. You've probably heard of the 'average' before. The mean is just a fancy mathematical term for the average. Think of it like this: If you have a group of friends and a bag of candies, and you want to share the candies so everyone gets an equal amount, that equal amount is the mean!
- Analogy: Imagine you have 10 cookies and 5 friends. If you share them equally, each friend gets 2 cookies. So, the mean number of cookies per friend is 2. You calculated this by adding up the total (10) and dividing by the number of friends (5). Simple, right?
What's a Frequency Table? (The "Neat Organizer" for Data)
Now, what about a frequency table? Imagine you've collected a lot of data, like the number of pets each student in your class owns. Instead of listing every single student's pet count one by one (e.g., '2, 1, 0, 2, 3, 1, 2, 0, 1, 1...'), a frequency table helps you organize this messy data neatly. It simply tells you how many times each specific value appears.
Here's what it looks like:
| Number of Pets (Value, x) | Number of Students (Frequency, f) |
|---|---|
| 0 | 5 |
| 1 | 10 |
| 2 | 8 |
| 3 | 2 |
In this table:
- The 'Value (x)' column lists the different number of pets reported (0, 1, 2, or 3).
- The 'Frequency (f)' column tells you how many students reported that specific number of pets. For example, 5 students have 0 pets, 10 students have 1 pet, and so on.
Analogy: Think of a frequency table like sorting a huge basket of fruit. Instead of writing 'apple, banana, apple, orange, grape, apple, banana...', you just count them up: 'Apples: 3, Bananas: 2, Oranges: 1, Grapes: 1'. It makes a long list much shorter and easier to understand quickly!
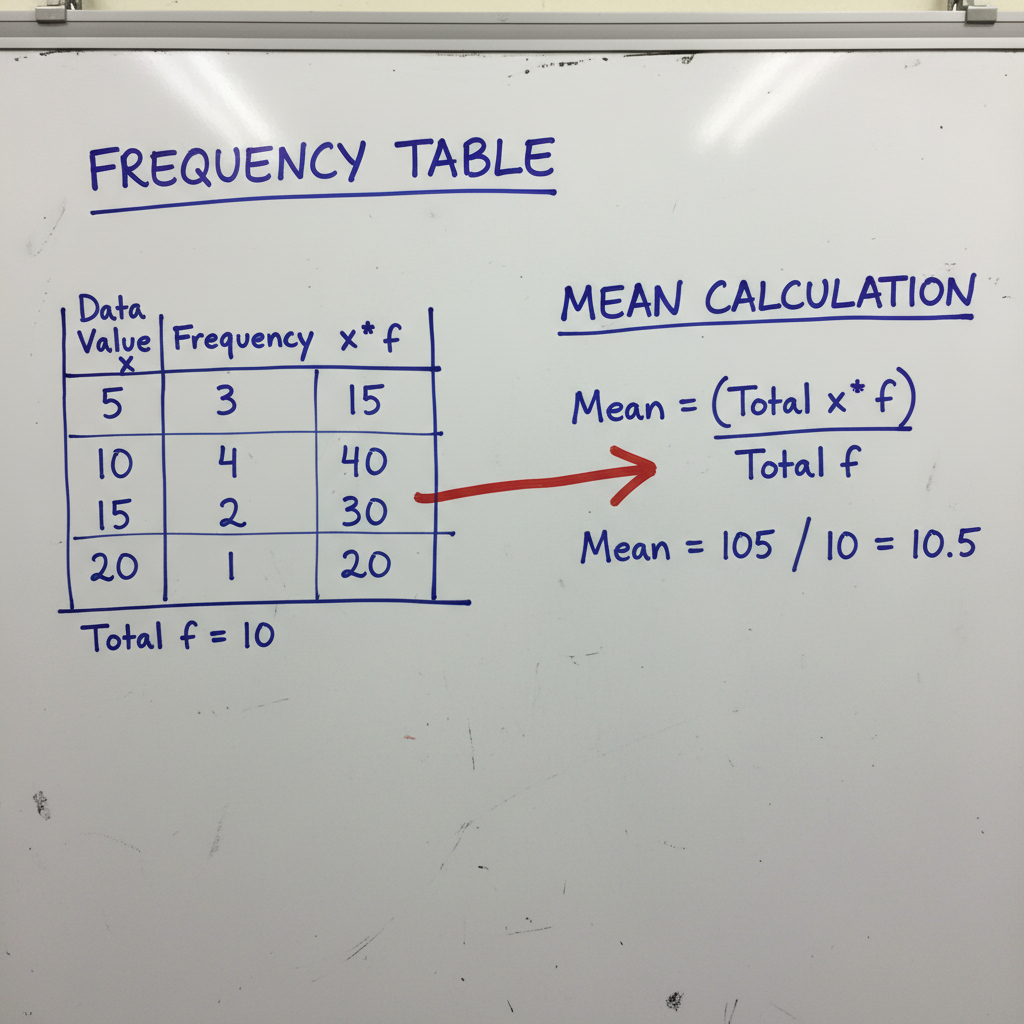
Why Use Frequency Tables to Calculate the Mean? (The "Smart Shortcut")
You might be wondering, why can't we just add up all the numbers and divide, like we did with the cookies? You absolutely can! However, when you have a lot of data, especially when many numbers repeat, a frequency table provides a much quicker and more organized way to get to the mean. It's like taking a shortcut on a long journey.
Imagine if 20 students scored 85 on a test. To find the total score for these students, you could add '85 + 85 + ...' twenty times. Or, you could simply do '85 * 20'. The frequency table helps us automatically take these kinds of shortcuts!
The Steps to Calculate the Mean from a Frequency Table
Let's use our pet example and turn it into a step-by-step guide:
Data: Number of pets owned by students.
| Number of Pets (x) | Number of Students (f) |
|---|---|
| 0 | 5 |
| 1 | 10 |
| 2 | 8 |
| 3 | 2 |
Step 1: Create a New Column for "Value times Frequency" (x * f)
This new column will show the 'total contribution' of each value. For each row, you multiply the 'Value (x)' by its 'Frequency (f)'.
- Analogy: If 5 students have 0 pets, their combined 'pet count' contribution is 0 * 5 = 0. If 10 students have 1 pet, their combined contribution is 1 * 10 = 10 pets. It's like saying, "These 10 people contribute 10 pets in total to our count."
| Number of Pets (x) | Number of Students (f) | x * f |
|---|---|---|
| 0 | 5 | 0 * 5 = 0 |
| 1 | 10 | 1 * 10 = 10 |
| 2 | 8 | 2 * 8 = 16 |
| 3 | 2 | 3 * 2 = 6 |
Step 2: Sum Up the 'x * f' Column (Σxf)
Now, add all the numbers in your new 'x * f' column. This gives you the grand total of all the 'pets' across all the students.
- Calculation: 0 + 10 + 16 + 6 = 32
- Analogy: This sum (32) is the *total number of pets* owned by *all* the students combined in the class. If you had gone around and asked each student individually and added their pet count, you'd get the same 32!
Step 3: Sum Up the 'Frequency' Column (Σf)
Next, add all the numbers in the 'Frequency (f)' column. This tells you the total number of data points you have, or in our case, the total number of students surveyed.
- Calculation: 5 + 10 + 8 + 2 = 25
- Analogy: This sum (25) is the *total number of students* who participated in the survey.
Step 4: Divide the Sum of (x * f) by the Sum of (f)
Finally, just like sharing cookies, you divide the total quantity (total pets) by the total number of recipients (total students).
Mean (x̄) = (Sum of x * f) / (Sum of f)
Mean (x̄) = 32 / 25 = 1.28
So, the mean number of pets per student is 1.28. It's perfectly normal for the mean to not be a whole number, even if individual data points are whole numbers. It represents the 'average share'.
The Formula: A Simple Summary
The formula for calculating the mean (often written as x̄, pronounced "x-bar") from a frequency table is:
x̄ = Σ(x * f) / Σf
- Σ (Sigma): This is a Greek letter that just means "sum of" or "add them all up."
- x: Represents each individual data value (like 0, 1, 2, 3 pets).
- f: Represents the frequency of each data value (how many times it appears).
- x * f: The product of the value and its frequency for each row.
- Σ(x * f): The sum of all the products from the 'x * f' column. This is the total value of all your data points combined.
- Σf: The sum of all the frequencies. This is the total number of data points.
Putting It All Together: Another Example
Let's say a teacher recorded the scores on a 5-point quiz for her class:
| Score (x) | Number of Students (f) | x * f |
|---|---|---|
| 1 | 2 | 1 * 2 = 2 |
| 2 | 5 | 2 * 5 = 10 |
| 3 | 8 | 3 * 8 = 24 |
| 4 | 6 | 4 * 6 = 24 |
| 5 | 4 | 5 * 4 = 20 |
| Totals | Σf = 2 + 5 + 8 + 6 + 4 = 25 | Σ(x * f) = 2 + 10 + 24 + 24 + 20 = 80 |
Now, calculate the mean:
Mean (x̄) = Σ(x * f) / Σf = 80 / 25 = 3.2
The average quiz score for the class is 3.2. See how easy it is when the data is organized?
Why is This Important in the Real World?
Calculating the mean from frequency tables isn't just a math exercise; it's a practical skill used everywhere:
- Businesses: To find the average number of items sold per day.
- Science: To find the average temperature over a period or the average growth of plants under certain conditions.
- Surveys: To find the average response to a question (e.g., average hours spent on homework).
- Healthcare: To calculate average patient ages or average recovery times.
By understanding how to do this, you're gaining a powerful tool to make sense of large amounts of data!
Keep learning, free
Create a free Syllabax account to unlock practice questions and games for this topic.
Visual Learning Enhanced! 🚀
To help you master this topic, we use Advanced Syllabax AI to generate detailed diagrams and visual models.
Note on Visuals: The AI sometimes makes spelling errors in image labels. Please refer to the lesson text for the correct terminology.