What Does the Graph Tell Us?
Watch this topic in 60 seconds
Free preview · Lesson 1
Understanding What Does the Graph Tell Us?
What Does the Graph Tell Us?
Hello, young explorers! Today, we're going on an exciting adventure to learn about special kinds of pictures called graphs. Imagine you have a big box of all your favorite toys, and you want to show your friend how many red cars, blue trucks, and green robots you have. You could just tell them, but what if you could show them in a super clear and fun way? That's what graphs do!
What is a Graph?
Think of a graph like a special kind of storybook, but instead of words, it uses pictures, lines, or bars to tell a story with numbers. It helps us see information very quickly and easily. It's like taking a snapshot of numbers and turning them into a visual masterpiece!
Why Do We Use Graphs?
Graphs are super helpful because they make comparing things a breeze! If you want to know if you have more red apples or green apples, a graph can show you in a blink. It helps us answer questions like: 'Which is the most?', 'Which is the least?', 'How many altogether?', or 'How many more of one than the other?' It's like having a superpower to understand numbers faster!
Meet the Bar Graph!
One very popular type of graph is called a Bar Graph. Imagine you are building towers with your building blocks. Some towers are tall, and some are short. A bar graph is a bit like that! It uses long, colorful bars to show how many of something there are.
Let's look at an example. Imagine we asked all your friends what their favorite fruit is. Some like apples, some like bananas, and some like oranges.
How to Read a Bar Graph:
- Look at the bottom (categories): This tells you what things we are counting. (Like 'Apples', 'Bananas', 'Oranges').
- Look at the side (numbers): This tells you 'how many'. (Like 0, 1, 2, 3, 4, 5...).
- Look at the bars: Each bar stands for one of the things. The taller the bar, the more of that thing there is! If a bar goes up to the number 4, it means there are 4 of that item.
So, if the 'Apple' bar is taller than the 'Banana' bar, it means more friends like apples than bananas! It's just like comparing the heights of your block towers!
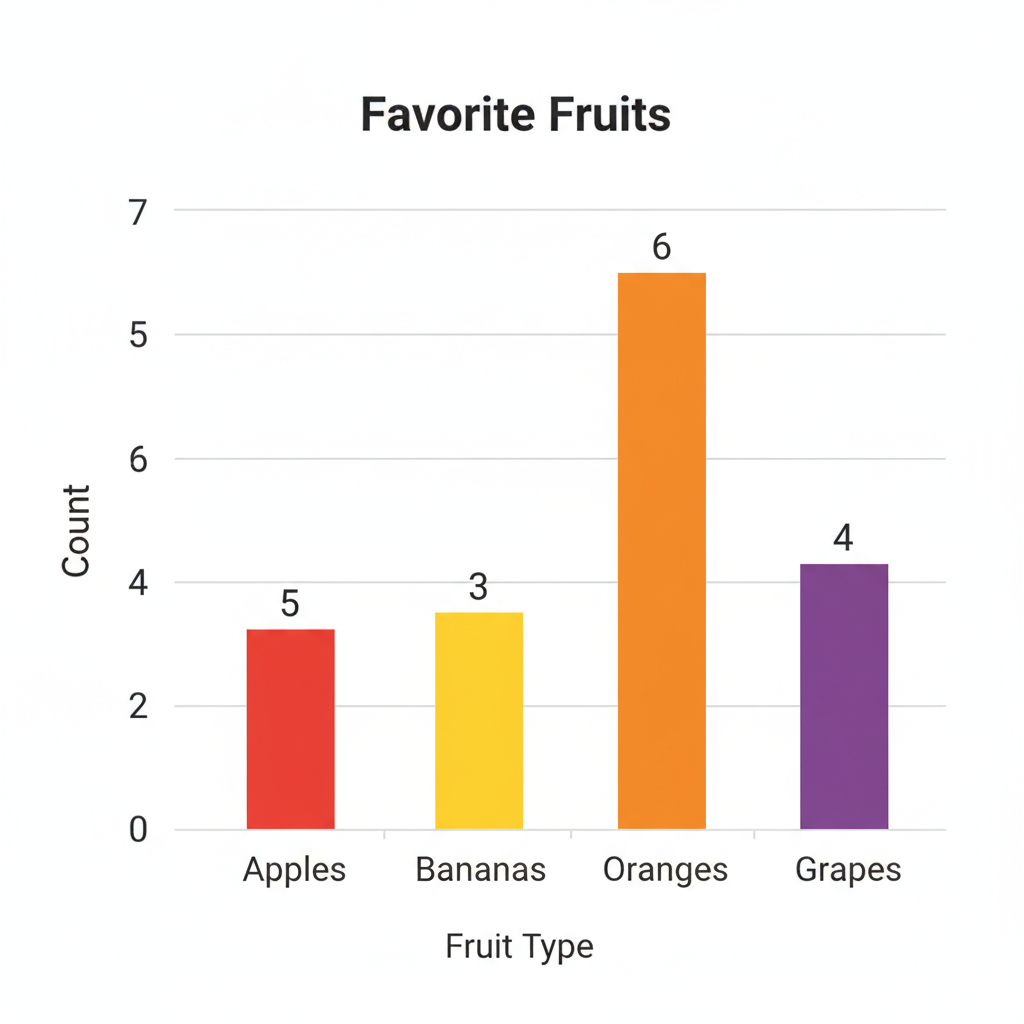
Looking at the picture above, can you tell which fruit is the most popular? Which one is the least popular? The tallest bar tells us the most, and the shortest bar tells us the least!
Discover the Pictograph!
Another super fun type of graph is called a Pictograph. As its name suggests, 'picto' sounds like picture, right? So, a pictograph uses little pictures or symbols to show how many of something there are! It's like having a sticker chart, where each sticker means something.
Let's say we counted how many different kinds of pets your classmates have. Some have dogs, some have cats, and some have fish.
How to Read a Pictograph:
- Look at the items: This tells you what things we are counting. (Like 'Dogs', 'Cats', 'Fish').
- Look at the pictures: Each picture stands for one of the items. Count the pictures to see how many!
- Look for the 'Key': This is super important! Sometimes, one little picture can stand for MORE than one item. For example, a key might say: "
 = 2 pets". That means if you see one picture of a dog, it really means there are 2 dogs! If you see two pictures of dogs, it means 2 + 2 = 4 dogs! Most times in Grade 1, one picture just means one item, but it's good to know about the key for later!
So, if there are more dog pictures than cat pictures, it means more classmates have dogs than cats. It's like counting your stickers!
In the pictograph above, can you count how many friends like dogs? How many like cats? Which animal is liked the most? Which is liked the least? Just count the pictures!
What Can Graphs Tell Us?
Once you know how to read bar graphs and pictographs, you become a super detective of numbers! You can quickly find out:
- Which has the most? Find the tallest bar or the row with the most pictures.
- Which has the least? Find the shortest bar or the row with the fewest pictures.
- How many altogether? Add up all the numbers or count all the pictures.
- How many more/less? Find the difference between two bars or two rows of pictures (subtract the smaller number from the bigger number).
Graphs help us organize information and make sense of numbers in a fun and colorful way. Keep practicing, and you'll be a graph expert in no time!
Keep learning, free
Create a free Syllabax account to unlock practice questions and games for this topic.
Visual Learning Enhanced! 🚀
To help you master this topic, we use Advanced Syllabax AI to generate detailed diagrams and visual models.
Note on Visuals: The AI sometimes makes spelling errors in image labels. Please refer to the lesson text for the correct terminology.