Dot Plots: Reading & Making
Watch this topic in 60 seconds
Free preview · Lesson 1
Understanding Dot Plots: Reading & Making
Understanding Dot Plots: Your Data's Secret Map!
Hey there, future data detectives! Have you ever wondered how to quickly make sense of a bunch of numbers? Imagine you've collected some data – maybe the number of pets your classmates have, or the scores from a recent pop quiz. Just looking at a long list of numbers can be like trying to find your way in a new city without a map. That's where dot plots come in! They're like a special kind of map that helps us see patterns and understand our data at a glance. Let's dive in and learn how to read and make these awesome data maps!
What is a Dot Plot? The Data Lineup!
Think of a dot plot as a way to organize numbers along a straight line, almost like people standing in a line for a roller coaster. Each person (or dot, in our case) represents one piece of information, and where they stand on the line tells us their 'value' or 'number'. When many people have the same value, they stand on top of each other, forming a little stack or 'skyscraper' of dots!
Definition: A Dot Plot (sometimes called a line plot) is a type of simple graph that displays data values as dots above a number line. Each dot represents a single observation from the dataset.
Why do we use them? Dot plots are super useful for:
- Seeing how often each number appears (this is called frequency).
- Spotting patterns, like where most of the numbers are grouped.
- Finding unusual numbers that stand out.
- Working with smaller sets of data.
The Building Blocks of a Dot Plot
1. The Data: Our Ingredients!
Before you can make a cake, you need ingredients, right? For a dot plot, our 'ingredients' are the numbers we've collected. This collection of numbers is called your data set. For example, if you asked 10 friends how many hours they spent reading last week, your data might look like this: 2, 3, 1, 3, 4, 2, 0, 3, 1, 2. Each of these numbers is an individual piece of data.
2. The Number Line: Our Street!
The foundation of every dot plot is a good old-fashioned number line. Remember drawing these in earlier grades? It's just a straight line with numbers marked at regular intervals. This line helps us organize our data from smallest to largest. Imagine it as a street, and each number on the street is a house address where our 'dots' will live.
How to MAKE a Dot Plot: Step-by-Step Guide
Let's use an example to walk through the process of making a dot plot. Imagine we asked 12 students how many siblings (brothers or sisters) they have, and here are their answers:
1, 0, 2, 1, 3, 1, 0, 2, 4, 1, 2, 1
Step 1: Get Your Data Organized! (Sort It Out)
It's always a good idea to sort your data from the smallest number to the largest. This isn't strictly necessary for a dot plot, but it makes it much easier to draw your number line and place your dots accurately. Let's sort our siblings data:
0, 0, 1, 1, 1, 1, 1, 2, 2, 2, 3, 4
Notice the smallest number is 0 and the largest is 4.
Step 2: Draw Your Number Line! (The Street for Your Dots)
Draw a straight horizontal line. Then, look at your sorted data to figure out the smallest and largest numbers. Your number line needs to include all these numbers, plus maybe one or two beyond them to make sure you cover all possibilities clearly. For our siblings data (0 to 4), a number line from 0 to 5 would be perfect. Make sure the numbers are evenly spaced!
Step 3: Title and Label Your Plot!
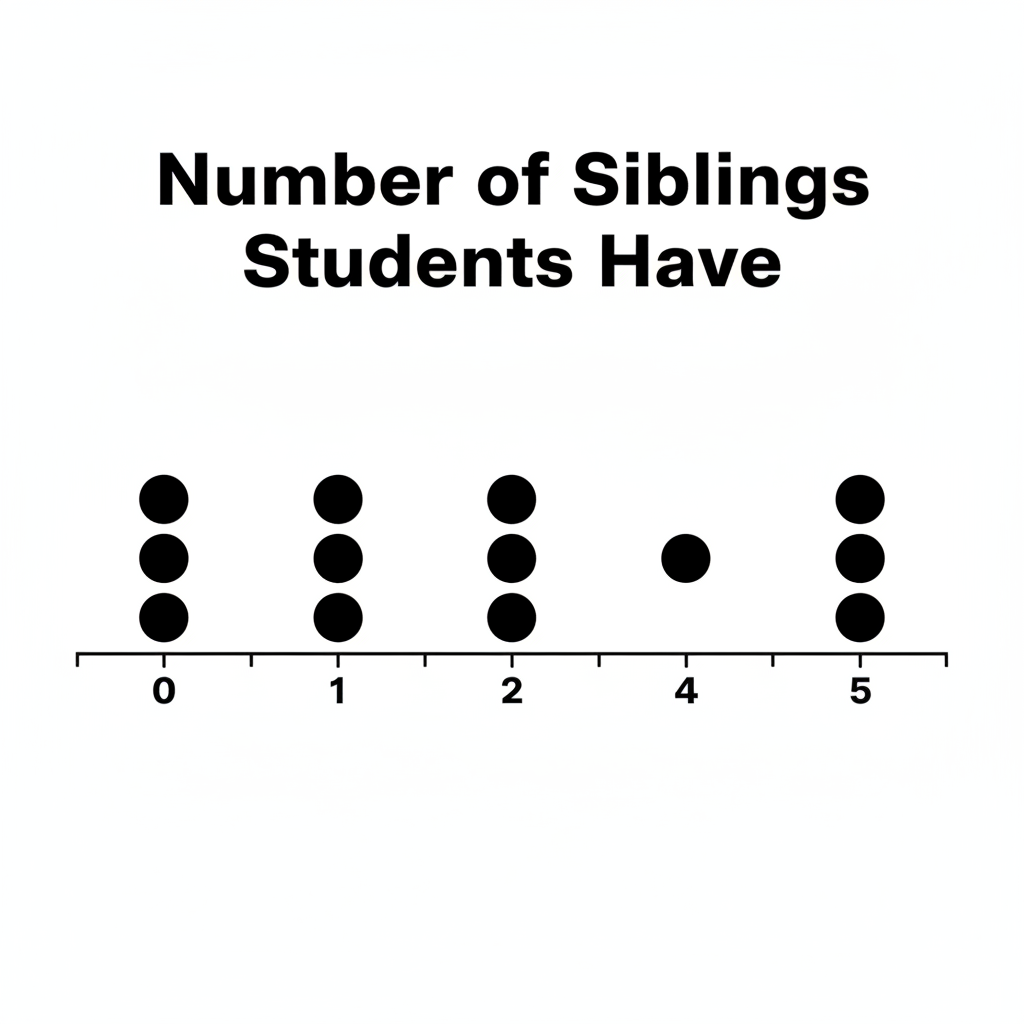
Just like any good map needs a title and labels, so does your dot plot! Give it a clear title that tells people what the data is about (e.g., "Number of Siblings Students Have"). Also, label your number line so people know what the numbers represent (e.g., "Number of Siblings").
Step 4: Place Your Dots! (Build Your Skyscrapers)
Now for the fun part! Go through your data, one number at a time. For each number, place a dot directly above that number on your number line. If you have the same number multiple times, stack the dots one above the other, making a 'skyscraper' of dots for that value.
- For '0': Place two dots above 0.
- For '1': Place five dots above 1.
- For '2': Place three dots above 2.
- For '3': Place one dot above 3.
- For '4': Place one dot above 4.
Make sure your dots are roughly the same size and are spaced consistently, both horizontally (above the numbers) and vertically (when stacking them).
Here's what our finished dot plot would look like:
How to READ a Dot Plot: Unlocking the Secrets!
Once you've made (or are looking at) a dot plot, it's time to be a data detective and interpret what it's telling you. Dot plots are great because they make it easy to see certain features of the data:
1. Frequency: How Often Does It Happen?
The height of the 'skyscraper' (the number of dots) above each number tells you its frequency. It shows you how many times that particular value appeared in your data. In our sibling example:
- The frequency of 0 siblings is 2 (there are 2 dots above 0).
- The frequency of 1 sibling is 5 (there are 5 dots above 1). This is the most frequent number!
- The frequency of 4 siblings is 1.
2. Clusters: Where Are the Crowds?
A cluster is a group of data points that are close together. It's like seeing a crowd of people in one area of the street. In our sibling plot, you can see a big cluster between 0 and 2. This tells us that most students have 0, 1, or 2 siblings.
3. Gaps: Are There Empty Spaces?
A gap is an area on the number line where there are no data points (no dots). It's like an empty stretch of road with no houses. Our sibling plot has no gaps between the numbers 0-4, but if we extended the number line to 5, there would be a gap at 5 because no one has 5 siblings. Gaps can tell you if certain values are not common or not present in your data.
4. Outliers: The Lone Wolves!
An outlier is a data point that is much, much smaller or much, much larger than most of the other data points. It's like a single house far away from the main town. In our sibling plot, the student with 4 siblings might be considered an outlier because most students have fewer siblings (0, 1, or 2). Outliers can sometimes represent unusual situations or errors in data collection.
5. Range: How Spread Out Is It?
The range of the data is the difference between the highest value and the lowest value. It tells you how spread out your data is. In our sibling data, the highest value is 4 and the lowest is 0. So the range is 4 - 0 = 4.
Dot Plots vs. Other Graphs: When to Use Which?
Dot plots are great for showing patterns in small to medium-sized datasets, especially when you want to see every single data point and its exact frequency. For very large datasets, or when you need to show percentages or changes over time, other graphs like histograms, bar graphs, or line graphs might be more suitable. But for quick, clear insights into individual data values, dot plots are a fantastic tool!
So, next time you see a collection of numbers, remember your dot plot map! You'll be able to quickly organize them, spot the trends, and become a true data expert!
Keep learning, free
Create a free Syllabax account to unlock practice questions and games for this topic.
Visual Learning Enhanced! 🚀
To help you master this topic, we use Advanced Syllabax AI to generate detailed diagrams and visual models.
Note on Visuals: The AI sometimes makes spelling errors in image labels. Please refer to the lesson text for the correct terminology.