Reading Picture Graphs
Watch this topic in 60 seconds
Free preview · Lesson 1
Understanding Reading Picture Graphs
Let's Read Picture Graphs!
Hello, young learners! Today, we're going on an exciting adventure to learn about something super cool called a Picture Graph. Imagine you want to tell a story using pictures instead of just words. That's exactly what a picture graph helps us do!
What is a Picture Graph?
Think of a picture graph as a special chart that uses pictures to show us how much of something there is. It's like a visual tally counter. Instead of writing 'three apples,' we might just draw three little apple pictures!
Analogy: Imagine you have a toy box, and you want to show your friend how many red cars, blue cars, and yellow cars you have. You could just line them up and point, right? A picture graph does something similar, but on paper!
Why Do We Use Picture Graphs?
Picture graphs make it super easy and fun to understand information quickly. They help us answer questions like: 'Which is the most popular?' or 'How many more of this are there than that?' They're like a quick snapshot of information.
The Super Important Parts of a Picture Graph
Every good picture graph has a few key parts, just like every good story has a title and characters. Let's explore them:
1. The Title: What's the Story About?
Every picture graph needs a title. The title tells us what the graph is all about. It's like the name of a book! For example, a title might be 'Favorite Fruits' or 'Number of Pets in Our Class.'
Analogy: If you're building with LEGOs, the title tells you what you're building – a house, a car, or a spaceship!
2. The Labels: What Are We Counting?
Labels tell us what different categories or groups we are looking at. If your graph is about 'Favorite Colors,' the labels might be 'Red,' 'Blue,' 'Green,' and 'Yellow.'
Analogy: If you sort your socks, the labels would be 'Striped Socks,' 'Polka Dot Socks,' and 'Plain Socks.' Each label helps you know what's in that pile!
3. The Pictures/Symbols: The Actual Count!
These are the fun pictures! Each picture represents a certain number of things. If you're counting apples, you'll see apple pictures. If you're counting stars, you'll see star pictures.
Analogy: These pictures are like the actual items in your toy box that you are counting!
4. The Key (or Legend): The Secret Code! This is the MOST important part!
The key is like a secret code or a magic decoder ring for your graph. It tells you what each picture stands for. Sometimes, one picture means '1 thing.' But other times, one picture might mean '2 things,' '5 things,' or even '10 things!'
Analogy: Imagine you're playing a treasure hunt. The key is the map that tells you what each symbol on the map means. Without the key, you won't know if a 'star' means one step, or five steps!
For example, a key might say: 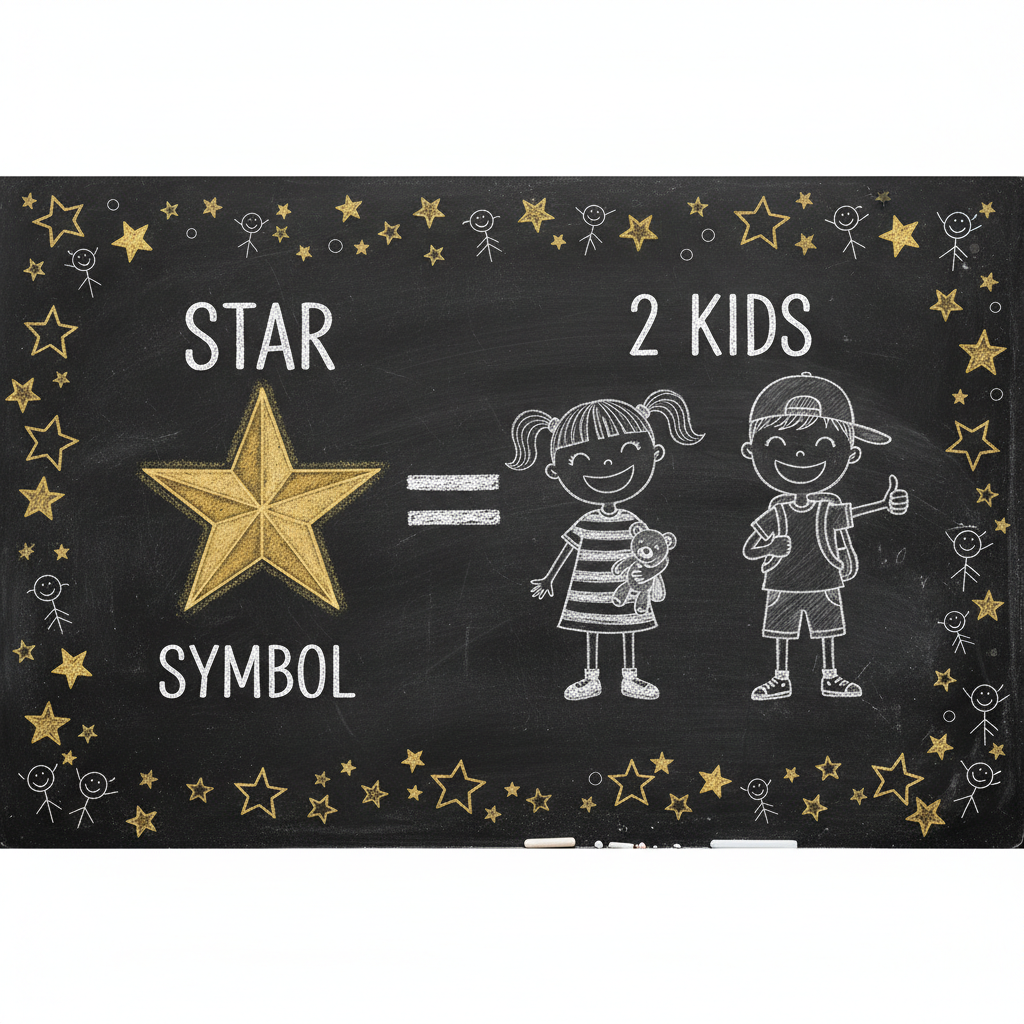 . This means if you see one star picture, it actually counts as 2 kids!
How to Read a Picture Graph: Step-by-Step
Let's pretend we have a picture graph showing favorite pets. Here's how we would read it:
- Look at the Title: What is the graph about? (e.g., 'Favorite Pets in Our Class').
- Look at the Labels: What are the different types of pets? (e.g., Dogs, Cats, Fish).
- Find the Key: This is crucial! Look for the key to see what each picture stands for. (e.g.,
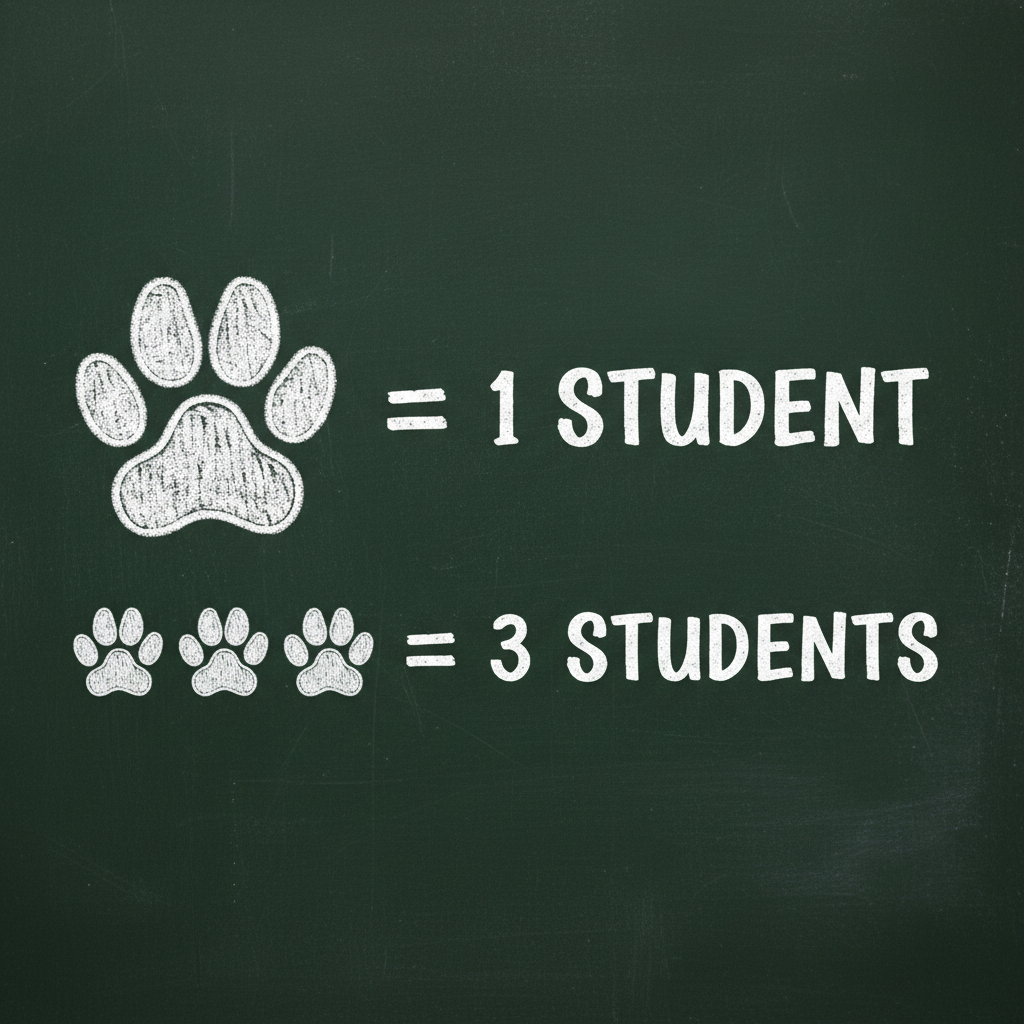 means one paw print picture equals 1 student).
- Count the Pictures: Now, for each label, count the number of pictures. Remember to use the key! If the key says one picture = 2, and you see 3 pictures, then you have 3 x 2 = 6!
- Answer the Questions: Once you've counted, you can answer questions like: 'How many students like dogs?' or 'Which pet is liked by the most students?'
Let's Do an Example Together!
Imagine a graph titled 'Our Favorite Ice Cream Flavors.'
- Labels: Vanilla, Chocolate, Strawberry
- Key: One ice cream cone picture () = 1 student
If you see:
- Vanilla:
- Chocolate:
- Strawberry:

How many students like Vanilla? Count the stars for Vanilla: 1, 2, 3, 4. Since each star is 1 student, 4 students like Vanilla!
How many students like Chocolate? Count: 1, 2, 3, 4, 5, 6. So, 6 students like Chocolate!
How many students like Strawberry? Count: 1, 2, 3. So, 3 students like Strawberry!
Remember the Key! Another Example:
What if the key for 'Our Favorite Ice Cream Flavors' was different?
- Key: One ice cream cone picture () = 2 students
Now, if you see 3 pictures for Strawberry, it's not 3 students. It's 3 pictures x 2 students per picture = 6 students! See how important the key is?
You are a Picture Graph Detective!
Now you have the tools to be a picture graph detective! Always remember to find the title, look at the labels, and most importantly, check the key! The key is your secret weapon to unlock the information in the graph.
Keep practicing, and soon you'll be a picture graph master, able to read any picture story that comes your way!
Keep learning, free
Create a free Syllabax account to unlock practice questions and games for this topic.
Visual Learning Enhanced! 🚀
To help you master this topic, we use Advanced Syllabax AI to generate detailed diagrams and visual models.
Note on Visuals: The AI sometimes makes spelling errors in image labels. Please refer to the lesson text for the correct terminology.