Types of Data: Categorical & Numerical
Watch this topic in 60 seconds
Free preview · Lesson 1
Understanding Types of Data: Categorical & Numerical
Understanding Data: Categorical vs. Numerical (Grade 10, Foundational)
Imagine you're trying to organize a massive collection of information. Maybe it's about all the students in your school, or all the types of animals in a zoo, or even just your own music library. To make sense of this information, the first crucial step is to understand what kind of data you're dealing with. Just like you wouldn't use a hammer to cut a piece of wood (you'd use a saw!), different types of data require different ways of thinking about them and different tools for analysis.
In statistics and data science, all data can generally be divided into two big families: Categorical Data and Numerical Data. Think of these as the two main sections in a giant library – every book (piece of data) belongs in one or the other, even if there are smaller sections within them.
The Two Big Families of Data
1. Categorical Data: Grouping Things Up
Definition: Categorical data represents characteristics or qualities that can be divided into groups or categories. It describes attributes, labels, or names, rather than measurements or counts. You can't perform meaningful mathematical operations (like addition or averaging) on categorical data in the same way you would with numbers.
Analogy: Sorting Your Favorite Candies
Imagine you have a big bag of assorted candies. You might sort them by their flavor (chocolate, strawberry, mint), their color (red, green, blue), or their type (gummy bear, lollipop, chocolate bar). Each of these groupings – flavor, color, type – represents categorical data. You're not counting how many grams each candy weighs; you're just putting them into labeled bins.
Key Characteristics of Categorical Data:
- Labels and Names: It uses words or codes to classify items.
- Non-Numerical Meaning: Even if numbers are used (e.g., '1' for male, '2' for female), these numbers are just labels and don't have mathematical value in themselves. You wouldn't say that '2' is twice '1' in this context.
- Frequency Counts: You can count how many items fall into each category (e.g., 'There are 15 red candies,' 'There are 10 chocolate bars').
Examples of Categorical Data:
- Gender: Male, Female, Non-binary
- Hair Color: Brown, Black, Blonde, Red
- Favorite Sport: Soccer, Basketball, Tennis, Swimming
- Movie Genre: Action, Comedy, Drama, Sci-Fi
- Education Level: High School, Bachelor's, Master's, PhD
- Yes/No Responses: Have you eaten breakfast? (Yes/No)
Sub-types of Categorical Data (A Quick Peek):
Within the categorical family, we can sometimes make a further distinction:
-
Nominal Data: These are categories that have no natural order or ranking. Each category is distinct and equal. Think of different shaped blocks in a toy box – a square block isn't 'better' or 'bigger' than a circular block in terms of its shape, just different.
- Examples: Hair color, favorite animal, nationality, marital status.
-
Ordinal Data: These are categories that *do* have a meaningful order or ranking, but the difference between categories isn't necessarily consistent or measurable. Think of different sized containers (small, medium, large) – you know 'large' is bigger than 'medium,' but you can't say 'large' is exactly 'twice' 'small' without more information.
- Examples: Education level (High School < Bachelor's < Master's), customer satisfaction ratings (Very Dissatisfied, Dissatisfied, Neutral, Satisfied, Very Satisfied), movie ratings (G, PG, PG-13, R).
2. Numerical Data: Counting and Measuring Things
Definition: Numerical data (also called quantitative data) represents quantities – things that can be measured or counted. This type of data is always expressed in numbers, and these numbers have a true numerical meaning. You can perform mathematical operations like addition, subtraction, multiplication, and division on numerical data, and the results will be meaningful.
Analogy: Tracking Your Game Scores or Savings
Imagine you're playing a video game and keeping track of your score, or you're saving money and watching your bank balance grow. Your game score (e.g., 1500 points) and your bank balance (e.g., $250.75) are examples of numerical data. You can compare scores (1500 is higher than 1200), add money to your balance, or calculate the average score over several games. The numbers actually *mean* something in a quantitative way.
Key Characteristics of Numerical Data:
- Numbers with Meaning: The values are real numbers that represent counts or measurements.
- Mathematical Operations: You can add, subtract, multiply, and divide these numbers meaningfully.
- Order and Magnitude: There's a clear order, and the differences between values are meaningful (e.g., 20 degrees Celsius is warmer than 10 degrees Celsius, and the difference is 10 degrees).
Examples of Numerical Data:
- Age: 16 years, 45 years
- Height: 175 cm, 5 feet 9 inches
- Weight: 65 kg, 143 lbs
- Temperature: 25°C, 77°F
- Number of Siblings: 0, 1, 2, 3
- Test Scores: 88%, 92 points
- Number of Books Read: 12 books
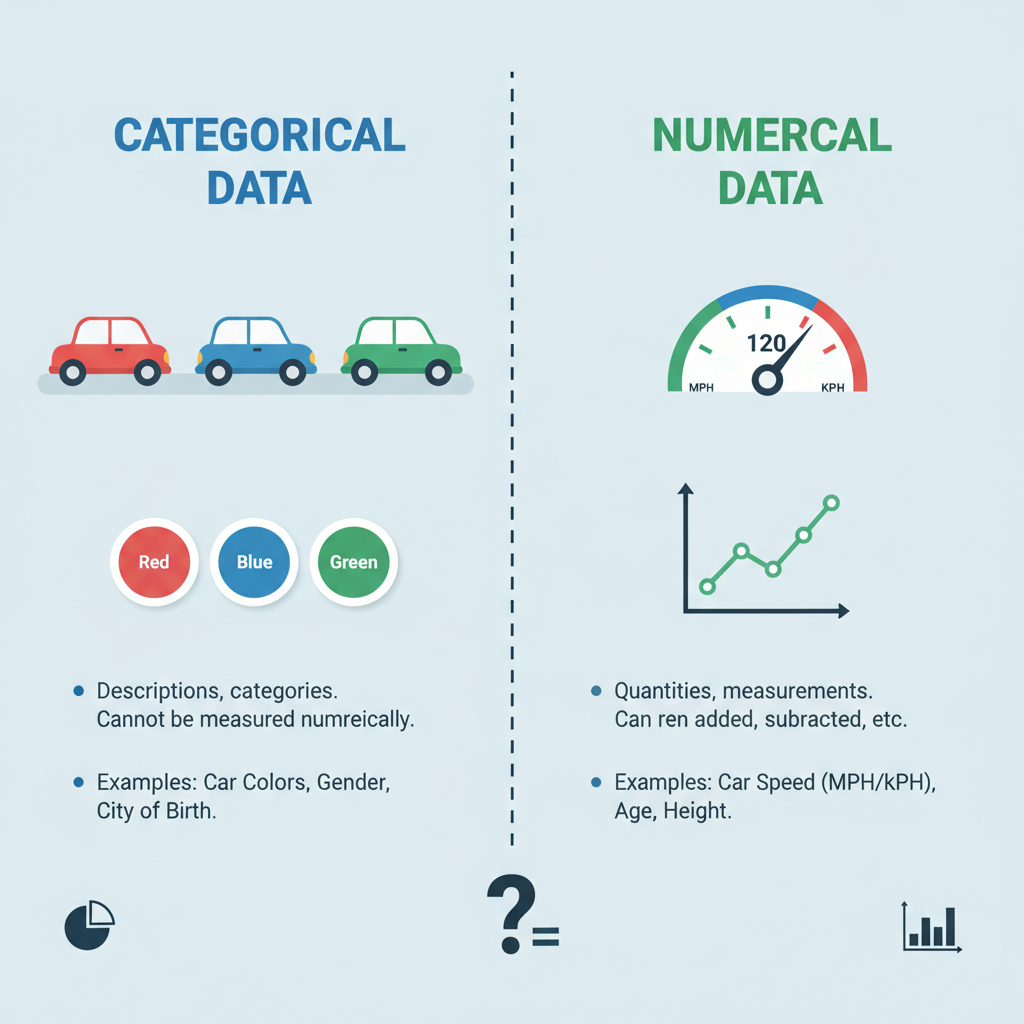 ⚠️ This picture may have spelling mistakes. Trust the words in the lesson.
Sub-types of Numerical Data (A Quick Peek):
Numerical data can also be broken down further:
-
Discrete Data: This is numerical data that can only take on specific, distinct values, usually whole numbers, that result from counting. There are often 'gaps' between possible values. Think of counting individual candies in a jar – you can have 1 candy, 2 candies, but not 1.5 candies.
- Examples: Number of students in a class, number of cars in a parking lot, number of goals scored in a game, number of pets a person owns.
-
Continuous Data: This is numerical data that can take any value within a given range. It typically results from measuring. There are no 'gaps' between possible values; you can always find a value in between any two other values. Think of filling a cup with water – the volume could be 100ml, 100.5ml, 100.57ml, and so on, depending on how precisely you measure it.
- Examples: Height of a person, weight of an object, temperature of a room, time it takes to run a race, amount of rainfall.
Why Does This Classification Matter?
Understanding whether data is categorical or numerical is foundational to everything you'll do with data. It dictates:
- How you organize it: Different types of tables or databases might be better for one type over another.
- How you visualize it: You'd use a bar chart for categorical data (e.g., number of students per grade) but a histogram or scatter plot for numerical data (e.g., distribution of test scores).
- What calculations you can perform: You can calculate an average for numerical data (average height), but not for categorical data (what's the average hair color?). For categorical data, you'd calculate frequencies or modes.
- What statistical tests you can apply: Different statistical methods are designed for different data types.
Think of it like choosing the right tool for a job. If you're tightening a screw, you need a screwdriver; a hammer won't work. Similarly, if you're trying to find the 'average' of eye colors, you're using the wrong tool because eye color is categorical. But if you want the average age, a numerical calculation is perfect!
Conclusion
Categorical and numerical data are the fundamental building blocks of almost all information we encounter. By learning to distinguish between them, you've taken a massive first step towards becoming a data-savvy individual, ready to interpret the world around you with greater clarity and precision. Keep practicing classifying different kinds of information, and you'll soon find it second nature!
Keep learning, free
Create a free Syllabax account to unlock practice questions and games for this topic.
Visual Learning Enhanced! 🚀
To help you master this topic, we use Advanced Syllabax AI to generate detailed diagrams and visual models.
Note on Visuals: The AI sometimes makes spelling errors in image labels. Please refer to the lesson text for the correct terminology.