Simple Tables -Data Interpretation (Foundation Level)
Watch this topic in 60 seconds
Free preview · Lesson 1
Simple Tables -Data Interpretation (Foundation Level) (Foundational)
Simple Tables - Data Interpretation (Foundation Level)
Hello, young scientists! Today, we're going to explore something super useful: simple tables and how to understand the information they give us. This is called data interpretation. Think of it as reading a secret code, but the code is just numbers and words organized neatly!
What is a Table?
A table is a way to organize information using rows and columns. Think of it like a grid, where each box tells you something specific. Tables help us see patterns and understand information quickly.
- Rows: These go across, like lines in a book.
- Columns: These go up and down, like soldiers standing in a line.
- Data: This is the information inside the table – numbers, words, pictures, anything!
How to Read a Simple Table
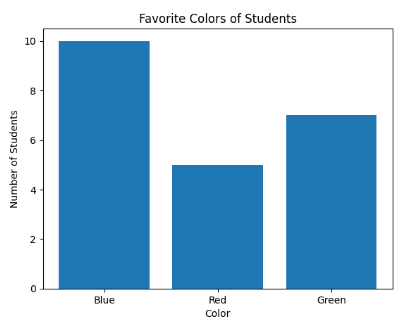
Let's learn how to read a simple table. Imagine we asked our classmates their favorite colors and made this table:

- Read the title: This table is about favorite colors.
- Read the column headings: The first column is 'Color', and the second is 'Number of Students'.
- Look at the data: 10 students like Blue, 5 like Red, and 7 like Green.
Interpreting the Data
Interpreting means understanding what the data tells us. From our table, we can see that Blue is the most popular color because more students chose it!
- Most: The largest number in the table.
- Least: The smallest number in the table.
 ⚠️ This picture may have spelling mistakes. Trust the words in the lesson.Why is this Important?
Tables help us make decisions and understand the world around us. For example, if you're planning a party, you can use a table to see which snacks your friends like the most!
Keep learning, free
Create a free Syllabax account to unlock practice questions and games for this topic.
Visual Learning Enhanced! 🚀
To help you master this topic, we use Advanced Syllabax AI to generate detailed diagrams and visual models.
Note on Visuals: The AI sometimes makes spelling errors in image labels. Please refer to the lesson text for the correct terminology.