What is 'Typical' Data?
Watch this topic in 60 seconds
Free preview · Lesson 1
Understanding What is 'Typical' Data?
Hello, young data detectives! Have you ever wondered what most of your friends like to eat for lunch, or what game almost everyone plays during recess? When you ask these kinds of questions, you're starting to think about 'data' and what's 'typical'! You're like a super-smart explorer, gathering clues to understand the world around you. Let's embark on this exciting journey to discover what 'typical' data means in simple, fun ways!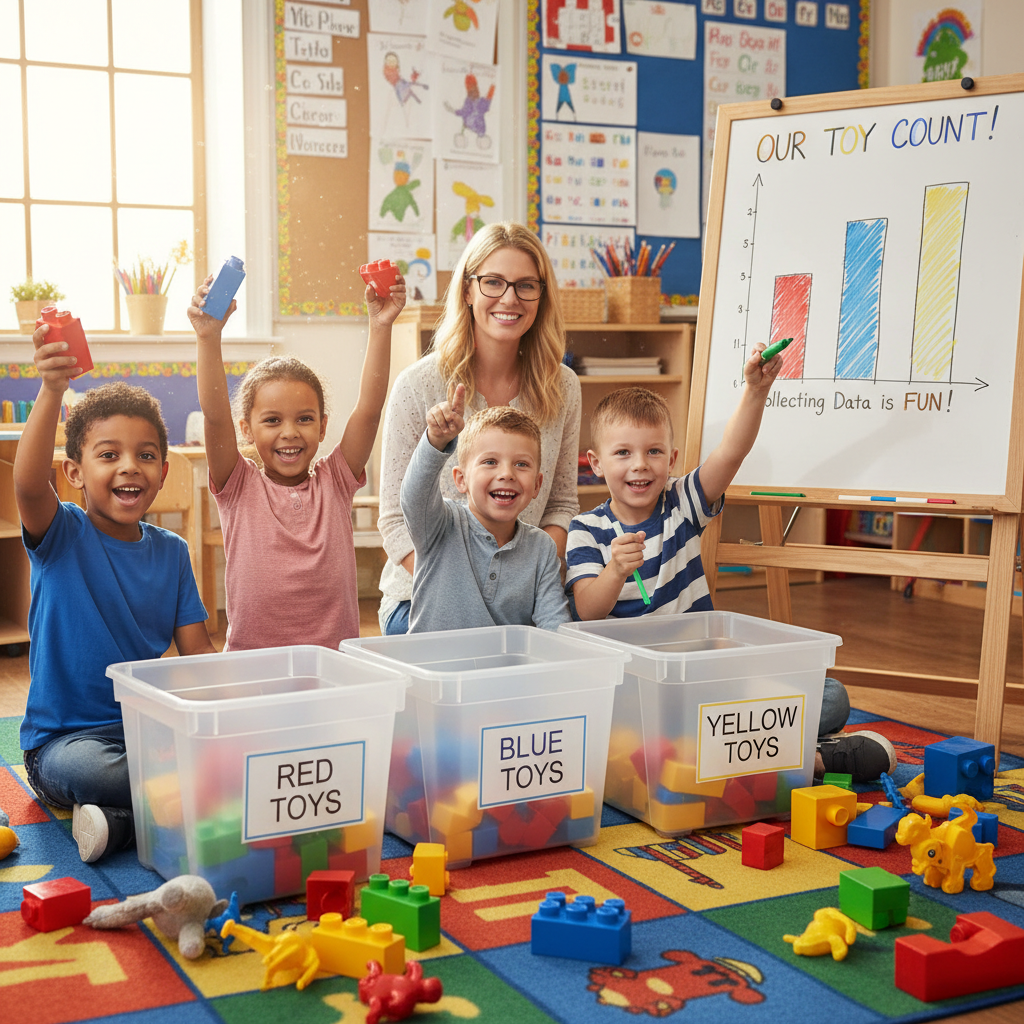

What is Data? Let's Collect Some Fun Facts!
Imagine you have a big box of LEGOs. Each LEGO brick is a little piece of information, right? You might have red bricks, blue bricks, green bricks, and yellow bricks. If you count how many of each color you have, you're collecting **data**! Data is just a fancy word for information or facts that we collect about things. It's like gathering clues in a mystery or collecting interesting items for a show-and-tell.- **Analogy 1: LEGO Bricks** - Each brick (its color, size, shape) is a piece of data. If you count them, you're making a data list!
- **Analogy 2: Favorite Animals** - If you ask everyone in your class their favorite animal, each answer (dog, cat, fish, bird) is a piece of data. You're collecting facts about what people like.
What Does 'Typical' Mean? Like Your Favorite Snack!
Now, what about the word 'typical'? Think about your favorite snack. Maybe it's apples, or maybe it's pretzels. If you asked all your classmates what their favorite snack is, and most of them said 'apples,' then apples would be the *typical* favorite snack in your class! 'Typical' just means what is common, usual, or what happens most often. It's like finding the 'star' of your data collection, the one that stands out as being very popular or representing the middle ground. We have special ways to find out what's typical. We're going to learn about three super-helpful data tools: the **Mode**, the **Median**, and the **Mean** (which is also called the **Average**). Don't worry, they sound fancy, but they're just different ways to find the 'star' of your data!Finding the 'Typical' Star: The Mode! (The Most Popular!)
Imagine your teacher asks everyone in the class what their favorite color is. You write down their answers:- Sarah says Blue
- Tom says Red
- Maria says Yellow
- David says Blue
- Lily says Green
- Ben says Red
- Chloe says Blue
- Blue: 3 times
- Red: 2 times
- Yellow: 1 time
- Green: 1 time
- **Analogy 3: Popular Pet** - If 10 kids have dogs, 3 have cats, and 2 have fish, then dogs are the mode because more kids have dogs than any other pet. It's the most common pet!
- **Analogy 4: Ice Cream Flavors** - If a shop sold 50 strawberry cones, 30 chocolate cones, and 40 vanilla cones in one day, then strawberry would be the mode. It was the most frequently chosen flavor!
Finding the 'Typical' Star: The Median! (The Middle Person!)
Okay, imagine you and your friends are lining up for a game, and your teacher wants you to stand from shortest to tallest. Let's say their heights (in inches) are: 45 inches, 48 inches, 42 inches, 50 inches, 46 inches. First, to find the **Median**, we need to put our data in order from smallest to biggest (or biggest to smallest). Like lining up all your friends from shortest to tallest! 42, 45, 46, 48, 50. Now, we just find the number that's exactly in the middle! You can do this by crossing out numbers from each end:- Cross out 42 (smallest) and 50 (biggest).
- Cross out 45 (next smallest) and 48 (next biggest).
- Aha! The number left in the middle is **46**!
- **Analogy 5: Kids in a Line** - If five kids line up by height, the kid standing in the very middle is the median height. Half the kids are shorter, and half are taller.
- **Analogy 6: Stack of Books** - If you have different sized books and you stack them from shortest to tallest, the book exactly in the middle of the stack is the median height book.
Finding the 'Typical' Star: The Mean! (The Fair Share!)
The **Mean**, also called the **Average**, is all about sharing fairly! Imagine you and your three friends collected some colorful stickers.- You have 5 stickers.
- Friend 1 has 3 stickers.
- Friend 2 has 6 stickers.
- Friend 3 has 2 stickers.
- **Analogy 7: Sharing Cookies** - If you have three friends and one has 4 cookies, one has 2 cookies, and one has 6 cookies, to find the mean, you'd collect all the cookies (4+2+6=12) and share them equally among the 3 friends (12 ÷ 3 = 4 cookies each). The mean is 4 cookies.
- **Analogy 8: Pencils in Pots** - If you have three pencil pots with 7, 3, and 5 pencils, you can find the average by adding them (7+3+5=15) and dividing by the number of pots (15 ÷ 3 = 5 pencils per pot). This tells you the typical number of pencils in each pot if they were all equal.
Why Does 'Typical' Data Matter?
Understanding mode, median, and mean helps us make sense of big groups of information. It gives us a quick snapshot of what's common or what to expect without having to look at every single piece of data.- **For your school:** The principal might look at the *mode* of favorite lunch foods to decide what to put on the menu most often. This helps make sure most students are happy!
- **For a shoe store:** Knowing the *median* shoe size for 3rd graders helps them stock the right sizes so most kids can find shoes that fit easily.
- **For a sports team:** A coach might calculate the *mean* number of points players score in a game to see how well the team is doing on average. This helps them understand team performance.
Keep learning, free
Create a free Syllabax account to unlock practice questions and games for this topic.
Visual Learning Enhanced! 🚀
To help you master this topic, we use Advanced Syllabax AI to generate detailed diagrams and visual models.
Note on Visuals: The AI sometimes makes spelling errors in image labels. Please refer to the lesson text for the correct terminology.