Circle Graphs: Understanding Parts
Watch this topic in 60 seconds
Free preview · Lesson 1
Understanding Circle Graphs: Understanding Parts
Circle Graphs: Understanding Parts of a Whole
Hello, young mathematicians! Have you ever had a delicious pizza? Imagine a whole pizza cut into slices. Some slices might have pepperoni, some might have cheese, and maybe some have mushrooms. A circle graph, also known as a pie chart, is a lot like that pizza! It's a special way to show information, making it super easy to understand how different 'parts' make up a 'whole'.
What is a Circle Graph? (Think Pizza!)
A circle graph is a round chart that looks like a pie or a pizza. It's used to show how a whole thing is divided into different pieces or categories. Each piece, or "slice," represents a part of the total amount. When you add all the slices together, they make up the entire circle, or the "whole" pizza!
Analogy Time: The Birthday Cake! Imagine your birthday cake. It's one whole cake, right? When you cut it, you make slices. Some slices might be for family, some for friends. A circle graph shows you exactly how much of the cake (the whole) went to each group (the parts).
Key Parts of a Circle Graph
Just like a car has wheels and an engine, a circle graph has important parts that help us understand the information it's trying to share. Let's look at them:
1. The Circle (The Whole Pizza!)
The entire circle itself represents the 'whole' amount of whatever is being talked about. If we're talking about the favorite colors of students in your class, the whole circle represents ALL the students in your class. If it's about the types of pets people own, the whole circle represents ALL the pets.
Important Rule: All the parts of the circle graph, when added together, must equal the whole thing. In percentages, this means they always add up to 100%.
2. The Slices (The Pizza Slices!)
The circle is divided into different sections, which we call 'slices' or 'sectors'. Each slice represents a specific category or a different part of the whole. If a slice is big, it means that category makes up a large portion of the whole. If a slice is small, it means that category is a smaller part.
Analogy Time: A Bag of Marbles! Imagine you have a bag full of 100 marbles. Some are red, some are blue, some are green. If you made a circle graph of these marbles, each color would be a 'slice'. If there are more red marbles than blue ones, the 'red' slice on your graph would be bigger than the 'blue' slice.
3. Labels (What's on the Slice?)
How do you know what each slice represents? That's where labels come in! Each slice will have a label that tells you what category it stands for. For example, a slice might be labeled "Favorite Color: Blue" or "Pet Type: Dog." These labels are super important because they give meaning to each part of the graph.
4. Percentages or Fractions (How Big is the Slice?)
Often, each slice will also have a number written on it, usually a percentage (%) or sometimes a fraction. This number tells you exactly how much of the whole that slice represents. For instance, if a slice says "25%", it means that category makes up one-quarter (or 1/4) of the total. If another slice says "50%", it means that category makes up half (or 1/2) of the total.
Remember, all percentages in a circle graph must add up to 100%. This is like saying all your pizza slices together make up 100% of the pizza!
5. The Title (What's the Pizza About?)
Every good circle graph needs a title! The title is usually at the top of the graph and tells you what information the graph is showing. For example, a title might be "Favorite Ice Cream Flavors of 5th Graders" or "How Students Get to School." Always read the title first so you know what story the graph is telling!
Let's Look at an Example!
Here's a simple circle graph showing favorite fruits of a group of children. Look closely at all the parts we just talked about!
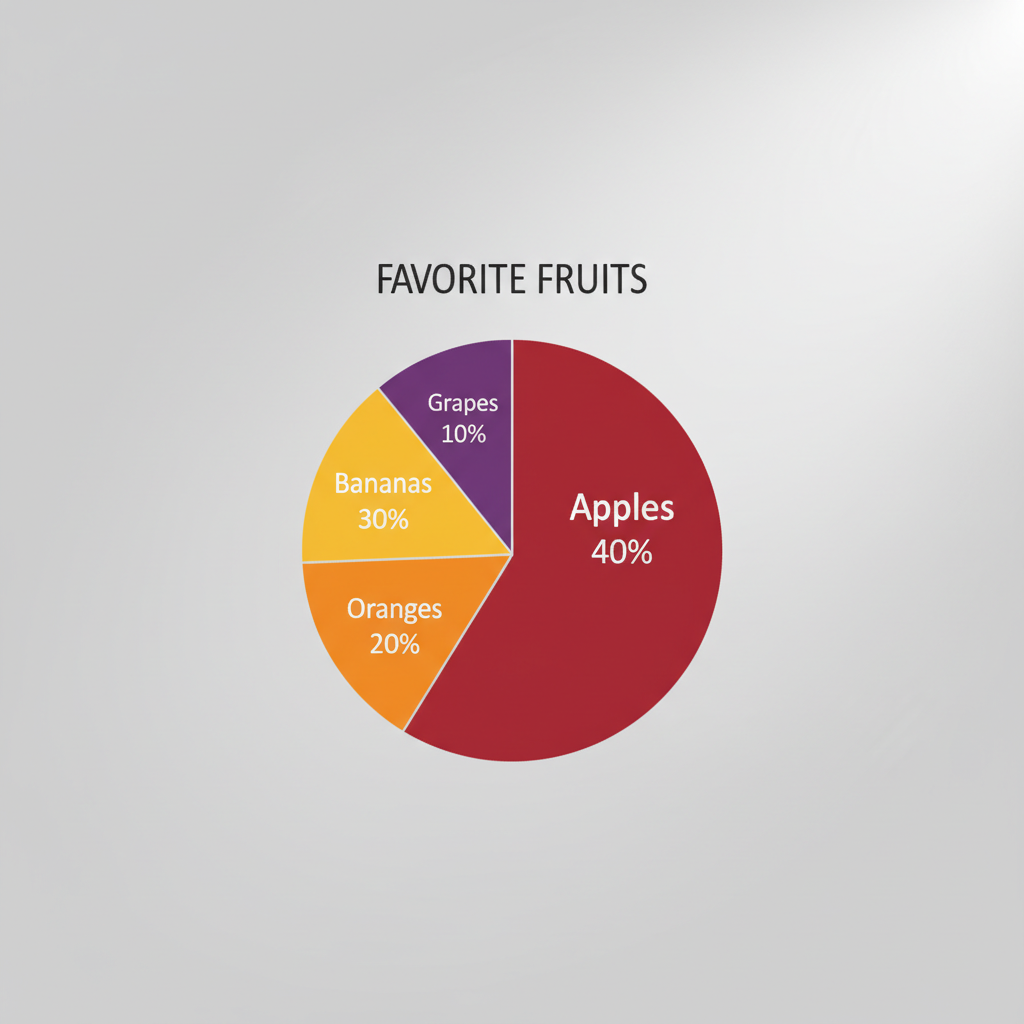
In this example:
- The Title is "Favorite Fruits of Class 5A." This tells us what the graph is about.
- The Whole Circle represents all the children in Class 5A who were asked about their favorite fruits.
- The Slices are for Apples, Bananas, Oranges, and Grapes.
- The Labels clearly state which fruit each slice represents.
- The Percentages tell us how many children chose each fruit: 40% liked Apples, 30% liked Bananas, 20% liked Oranges, and 10% liked Grapes.
Notice that if you add all the percentages: 40% + 30% + 20% + 10% = 100%. This confirms that all parts make up the whole group of children!
How to Read a Circle Graph (Be a Detective!)
Reading a circle graph is like being a detective, looking for clues! Here’s how you do it:
- Read the Title First: This is your biggest clue! It tells you the main topic.
- Look at the Slices and Labels: What are the different categories? What does each piece represent?
- Check the Percentages/Fractions: These numbers tell you how big each piece is compared to the whole.
- Compare the Slices: Which slice is the biggest? That category is the most popular or largest part. Which is the smallest? That's the least popular or smallest part.
- Find the Total: Remember, all the percentages must add up to 100%.
Analogy Time: Your School Day! Imagine a circle graph showing how you spend your time at school. One big slice might be "Learning" (maybe 60%), a smaller slice "Recess" (20%), and another for "Lunch" (20%). You can instantly see that most of your time is spent learning, and recess and lunch take up equal amounts of time.
Why Are Circle Graphs Useful?
Circle graphs are super helpful because they give us a quick and clear picture of how things are divided. They help us answer questions like:
- Which category is the most popular? (Look for the biggest slice!)
- Which category is the least popular? (Look for the smallest slice!)
- Are any categories the same size? (Look for slices with the same percentage!)
- How much bigger is one category compared to another?
They are used everywhere! In news reports, science projects, and even by businesses to show how money is spent. They make numbers and information much easier to understand at a glance.
This image helps you visualize how a whole circle can be broken down into different parts, ready to be filled with information!
So, next time you see a circle graph, remember your pizza! You'll be a pro at understanding how the whole pie is divided into tasty slices of information!
Keep learning, free
Create a free Syllabax account to unlock practice questions and games for this topic.
Visual Learning Enhanced! 🚀
To help you master this topic, we use Advanced Syllabax AI to generate detailed diagrams and visual models.
Note on Visuals: The AI sometimes makes spelling errors in image labels. Please refer to the lesson text for the correct terminology.