Comparing Data Points
Watch this topic in 60 seconds
Free preview · Lesson 1
Understanding Comparing Data Points
Comparing Data Points: Finding What's Different and What's the Same!
Hey amazing third graders! Welcome to a fun lesson where we'll become data detectives! Today, we're going to learn all about 'Comparing Data Points.' Don't worry, it sounds fancy, but it's really just about looking at information and figuring out what's bigger, smaller, or the same!
What Are Data Points?
Imagine you have a basket full of apples. Each apple is a 'thing.' If you count how many apples you have, like "I have 10 apples," that number, 10, is a piece of information. In math, we call these pieces of information 'data points.' They are like little clues or facts that tell us something.
- If you count the number of red cars you see on your way to school, that number is a data point.
- If you measure how many inches your plant grew, that measurement is a data point.
- If you keep track of how many goals your soccer team scored, those scores are data points.
Data points are everywhere, telling us stories about the world!
What Does "Comparing" Mean?
When you 'compare' things, it means you look very closely at them to see how they are alike and how they are different. It's like holding two crayons and deciding which one is longer, or tasting two different cookies to see which one is sweeter.
Analogy Time! Comparing Heights
Imagine you and your best friend stand back-to-back. You want to see who is taller! You are comparing your heights. Maybe you are taller, maybe your friend is taller, or maybe you are the exact same height! When you do this, you are 'comparing' your heights. You're looking to see a difference or a sameness.
 ⚠️ This picture may have spelling mistakes. Trust the words in the lesson.
How Do We Compare Numbers (Our Data Points)?
When we compare data points that are numbers, we use special words and symbols to show our findings:
- Greater Than (>): This means one number is bigger or more than the other number. Think of a hungry alligator mouth opening wide to eat the bigger number! The open mouth always points to the larger number.
- Less Than (<): This means one number is smaller or fewer than the other number. The alligator still wants the bigger number, so its mouth points away from the smaller one!
- Equal To (=): This means both numbers are exactly the same. They are perfectly balanced! Like two sides of a seesaw that are perfectly even.
Let's Practice with Candies!
Imagine you have 7 red candies and your friend has 5 blue candies.
- Is 7 red candies greater than 5 blue candies? Yes! Because 7 is a bigger number than 5. We write this as 7 > 5.
- Is 5 blue candies less than 7 red candies? Yes! Because 5 is a smaller number than 7. We write this as 5 < 7.
What if you had 6 yellow candies and your other friend also had 6 green candies?
- Is 6 yellow candies equal to 6 green candies? Yes! Because 6 is the exact same number as 6. We write this as 6 = 6.
It's like weighing two baskets on a scale. If one basket has 7 apples and the other has 5, the basket with 7 will go down (it's heavier/greater). If both have 6 apples, the scale will be balanced (they are equal!).
Comparing Different Kinds of Data
We don't just compare single numbers. We can compare groups of things or information that is organized in charts or graphs!
Analogy Time! Comparing Toy Collections
Sarah has 12 toy cars. Tom has 9 toy cars. Who has more toy cars? Sarah does! Her 12 cars are greater than Tom's 9 cars (12 > 9).
Maybe Amy has 8 dolls, and Lisa also has 8 dolls. They have an equal number of dolls (8 = 8).
Using Charts to Compare Data Visually
Sometimes, data points are shown in pictures or graphs. This makes it super easy to compare at a glance! Imagine a pictograph where each picture of a ball stands for 1 ball. If one team has 🏀🏀🏀🏀 (4 balls) and another has 🏀🏀 (2 balls), it's easy to see which has more!
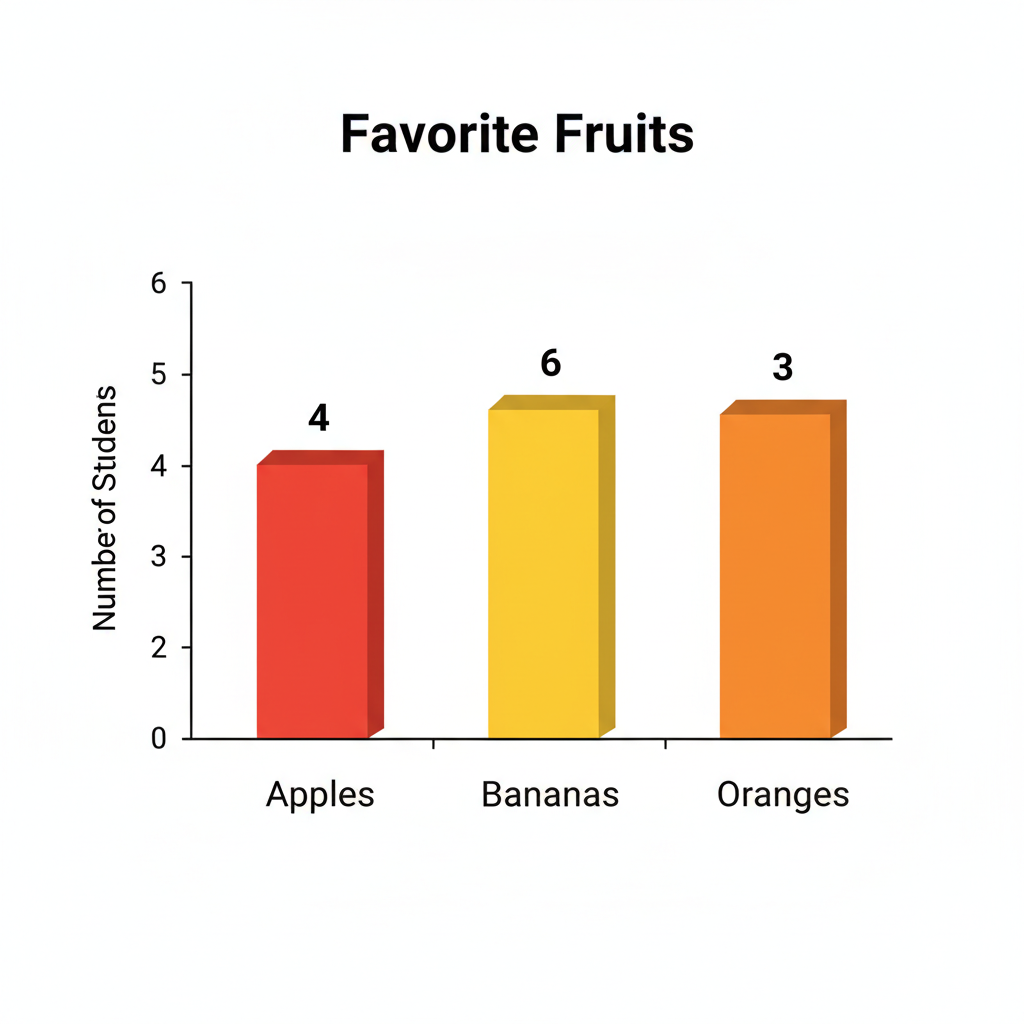
Let's look at a simple bar graph showing how many favorite fruits some kids have:
 ⚠️ This picture may have spelling mistakes. Trust the words in the lesson.
From this graph, we can quickly compare different data points:
- Are there more kids who like Bananas than Apples? Yes! The bar for Bananas goes up to 6, and the bar for Apples goes up to 4. Since 6 is greater than 4 (6 > 4), more kids like Bananas.
- Are there fewer kids who like Oranges than Apples? Yes! The bar for Oranges goes up to 3, and the bar for Apples goes up to 4. Since 3 is less than 4 (3 < 4), fewer kids like Oranges.
- Are there the same number of kids who like two different fruits? No, all the numbers (3, 4, 6) are different, so none are equal.
Using graphs is like having a superpower to compare many data points all at once!
Why is Comparing Data Points Important?
Comparing data helps us make sense of the world around us every single day! It helps us:
- Know who has more or less of something.
- Understand which team scored more points in a game.
- Decide which day had more sunshine or rain.
- Make fair choices, like if we need to share things equally.
- It's like being a detective, looking at clues (data points) and figuring out the story they tell!
So, the next time you look at numbers or groups of things, remember you're a data detective, ready to compare and discover interesting facts!
Keep learning, free
Create a free Syllabax account to unlock practice questions and games for this topic.
Visual Learning Enhanced! 🚀
To help you master this topic, we use Advanced Syllabax AI to generate detailed diagrams and visual models.
Note on Visuals: The AI sometimes makes spelling errors in image labels. Please refer to the lesson text for the correct terminology.