Simple Dot Plots
Watch this topic in 60 seconds
Free preview · Lesson 1
Understanding Simple Dot Plots
Let's Learn About Simple Dot Plots!
Hello, young mathematicians! Today, we're going on an exciting adventure to learn about something called a Dot Plot. It's a super cool way to show information, almost like telling a story with dots!
What is Data? (It's Not a Scary Word!)
Before we jump into dot plots, let's talk about data. Data is just information or facts. Imagine you want to know everyone's favorite color in your class, or how many pets each of your friends has. That information is 'data'!
- If you ask 5 friends: "How many pets do you have?"
- Friend 1 says: 2 pets
- Friend 2 says: 0 pets
- Friend 3 says: 1 pet
- Friend 4 says: 2 pets
- Friend 5 says: 1 pet
All those numbers (2, 0, 1, 2, 1) are your data! It's like collecting tiny treasures of information.
What is a Dot Plot? A Picture with Dots!
A dot plot is like a special chart that helps us see our data clearly. It uses a number line (like the one you use for counting!) and dots to show how often something happens. Think of it like this:
- Imagine you have a bunch of toy cars.
- You want to know how many cars are red, how many are blue, and how many are green.
- You could line them up: all the red cars together, then all the blue, then all the green.
- A dot plot does something similar, but with dots instead of cars!
It's super helpful for seeing things quickly, like "Which color car do I have the most of?" or "Which color car do I have the least of?"
The Parts of a Dot Plot: Getting to Know Our New Friend
Every good dot plot has a few important parts:
1. The Title: What's Our Story About?
Just like a book has a title to tell you what it's about, a dot plot needs a title. This tells us what kind of information we are looking at. For example, if we're looking at how many pets friends have, the title might be "Number of Pets My Friends Have."
2. The Number Line: Our Counting Road
This is a straight line with numbers on it, usually starting from 0 and going up. It's like a special road where each number is a stop. The numbers on this line show the different kinds of data we collected. For our 'number of pets' example, the number line might go from 0 (no pets) to 3 (3 pets).
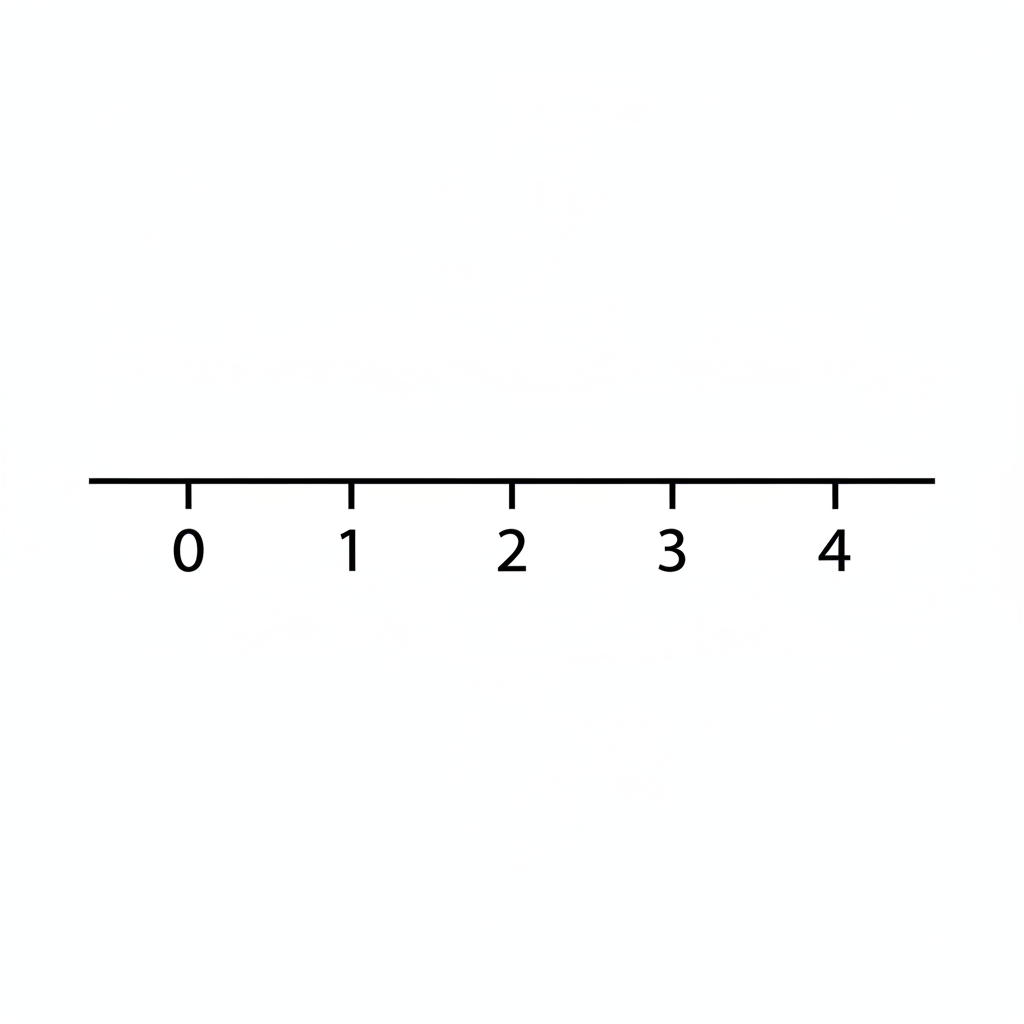
3. The Dots: Our Little Data Stickers!
This is where the magic happens! Each little dot on the dot plot stands for one piece of data. If one friend has 2 pets, you put one dot above the number 2 on the number line. If another friend also has 2 pets, you put another dot right above the first one, making a small stack.
- Think of each dot as one 'vote' or one 'item.'
- If 3 kids choose 'blue' as their favorite color, you'd put 3 dots above 'blue' on your chart.
Let's Make a Dot Plot Together!
Imagine we asked 10 kids how many siblings (brothers or sisters) they have. Here's our data:
2, 1, 0, 2, 3, 1, 0, 2, 1, 2
Step 1: Draw our Number Line.
What are the smallest and biggest numbers in our data? Smallest is 0, biggest is 3. So, our number line should go from 0 to at least 3 (let's go to 4 just in case!).
Step 2: Add the Title and Labels.
Our title could be "Number of Siblings." The numbers on our line represent "Number of Siblings."
Step 3: Place the Dots!
Now, for each piece of data, we put a dot above the correct number on our line. Let's do it:
- First number is 2: Put a dot above 2.
- Next is 1: Put a dot above 1.
- Then 0: Put a dot above 0.
- Next is 2: Put another dot above 2 (making a stack!).
- Then 3: Put a dot above 3.
- Next is 1: Put another dot above 1.
- Then 0: Put another dot above 0.
- Next is 2: Put a third dot above 2.
- Then 1: Put a third dot above 1.
- Last is 2: Put a fourth dot above 2.
When you're done, your dot plot might look something like this:
Reading a Dot Plot: What Can It Tell Us?
Once you have a dot plot, you can learn so much from it!
- Which one has the most? Look for the tallest stack of dots! In our sibling example, the number '2' has the most dots (4 dots), so most kids have 2 siblings.
- Which one has the least? Look for the shortest stack of dots or where there are no dots at all. In our example, '3' has the least dots (1 dot).
- How many people? Just count all the dots! Each dot is one person (or one piece of data). In our example, there are 10 dots, so we asked 10 kids.
- Are there any numbers with no dots? Sometimes a number on the line won't have any dots above it. That means no one in our group had that number of siblings (or pets, or whatever we are counting).
Dot plots are like special maps that help us understand information quickly and easily. Keep practicing, and you'll be a dot plot master in no time!
Keep learning, free
Create a free Syllabax account to unlock practice questions and games for this topic.
Visual Learning Enhanced! 🚀
To help you master this topic, we use Advanced Syllabax AI to generate detailed diagrams and visual models.
Note on Visuals: The AI sometimes makes spelling errors in image labels. Please refer to the lesson text for the correct terminology.