Making Bar Graphs
Watch this topic in 60 seconds
Free preview · Lesson 1
Understanding Making Bar Graphs
Making Bar Graphs: A Picture Story of Numbers!
Hello, young mathematicians! Have you ever seen a picture that tells you a story without using many words? That's a bit like what a graph does for numbers! Instead of just seeing a list of numbers, a graph helps us see and understand them quickly and easily. Today, we're going to learn about a super cool type of graph called a Bar Graph.
What is a Bar Graph? (It's Like Building Towers!)
Imagine you have a bunch of colorful building blocks, and you want to show how many of each color you have. You could line them up, right? A bar graph is a bit like that! It uses tall or long 'bars' (like your building blocks stacked up) to show how much or how many of different things there are. Each bar stands for something, and its height (or length) tells you its number.
Think of it this way: If you wanted to show your friends how many apples, bananas, and oranges your family bought, a bar graph would be perfect! You'd have one 'bar' for apples, one for bananas, and one for oranges. The apple bar would go up to the number of apples, the banana bar to the number of bananas, and so on. It's like a visual tally!
The Important Parts of a Bar Graph (Every Story Needs Details!)
Just like a good story has a title, characters, and a plot, a bar graph has important parts that help us understand the information it's showing. Let's look at them:
1. The Title: What's This Graph All About?
The Title is like the name of your story. It tells you immediately what information the bar graph is showing. For example, 'Favorite Colors of Grade 4 Students' or 'Number of Pets in Our Class'. It should be clear and at the top!
2. The Axes (Pronounced: AX-eez): The Streets and the Buildings!
A bar graph has two main lines that look like a giant 'L' shape. These are called the Axes (each one is an 'axis').
- The Horizontal Axis (X-axis): The Street Names! This is the line that goes straight across, from left to right. It's where you put the 'names' or 'categories' of the things you are counting. For our fruit example, this would be where 'Apples', 'Bananas', and 'Oranges' would be written. Think of it like the street names where you'll build your towers!
- The Vertical Axis (Y-axis): The Building Heights! This is the line that goes straight up and down. This axis shows the numbers or amounts. It's how high your bars will reach. If you have 5 apples, the 'apple' bar will go up to the '5' on this axis. Think of this as the scale that tells you how tall your buildings (bars) are.
3. The Labels: What Do These Streets and Buildings Mean?
Each axis needs a Label to tell us what it represents. For example, the horizontal axis might be labeled 'Types of Fruit', and the vertical axis might be labeled 'Number of Fruits'. These labels are super important so people know what your graph is actually showing.
4. The Scale: The Ladder to the Top!
The Scale is the set of numbers on the vertical axis (Y-axis). It shows how much each line or step on the axis is worth. For example, if you're counting by 1s (0, 1, 2, 3...), your scale is 1. If you're counting by 2s (0, 2, 4, 6...), your scale is 2. Choosing a good scale helps your bars fit nicely and makes the graph easy to read. It's like choosing how many rungs are on your ladder to reach the top of your building!
5. The Bars: The Actual Towers!
These are the colorful rectangles that show the data. Each bar should be the same width, and there should be some space between them so they don't look like one giant block. The height of each bar tells you its value according to the scale on the vertical axis.
How to Build Your Own Bar Graph (Step-by-Step!)
Making a bar graph is like following a recipe. Let's make one together!
Step 1: Collect Your Data (Gather Your Ingredients!)
First, you need to know what you're graphing. Let's say we asked 10 friends about their favorite ice cream flavors:
- Vanilla: 4 friends
- Chocolate: 3 friends
- Strawberry: 2 friends
- Mint: 1 friend
Step 2: Choose a Title (Name Your Recipe!)
What is our graph about? "Favorite Ice Cream Flavors of Friends" sounds good!
Step 3: Draw Your Axes (Set Up Your Workspace!)
Draw a large 'L' shape using a ruler. This will be your horizontal (X) and vertical (Y) axes.
Step 4: Label Your Axes (What Are These Lines For?)
- On the horizontal (bottom) axis, write the names of the ice cream flavors: Vanilla, Chocolate, Strawberry, Mint. Leave space between them. Label this axis 'Ice Cream Flavors'.
- On the vertical (side) axis, write the numbers. This will be 'Number of Friends'.
Step 5: Choose a Scale (How High Do We Go?)
Look at your data: the highest number is 4. So, counting by 1s (0, 1, 2, 3, 4, 5) on the vertical axis will work perfectly. Make sure to start at 0 at the corner where the two axes meet.
Step 6: Draw Your Bars (Start Building!)
Now, for each flavor, draw a bar! Use a ruler to make them neat.
- For Vanilla (4 friends), draw a bar that goes up to the line for '4' on your vertical axis.
- For Chocolate (3 friends), draw a bar that goes up to the line for '3'.
- For Strawberry (2 friends), draw a bar that goes up to the line for '2'.
- For Mint (1 friend), draw a bar that goes up to the line for '1'.
Remember to make all the bars the same width and leave the same amount of space between them.
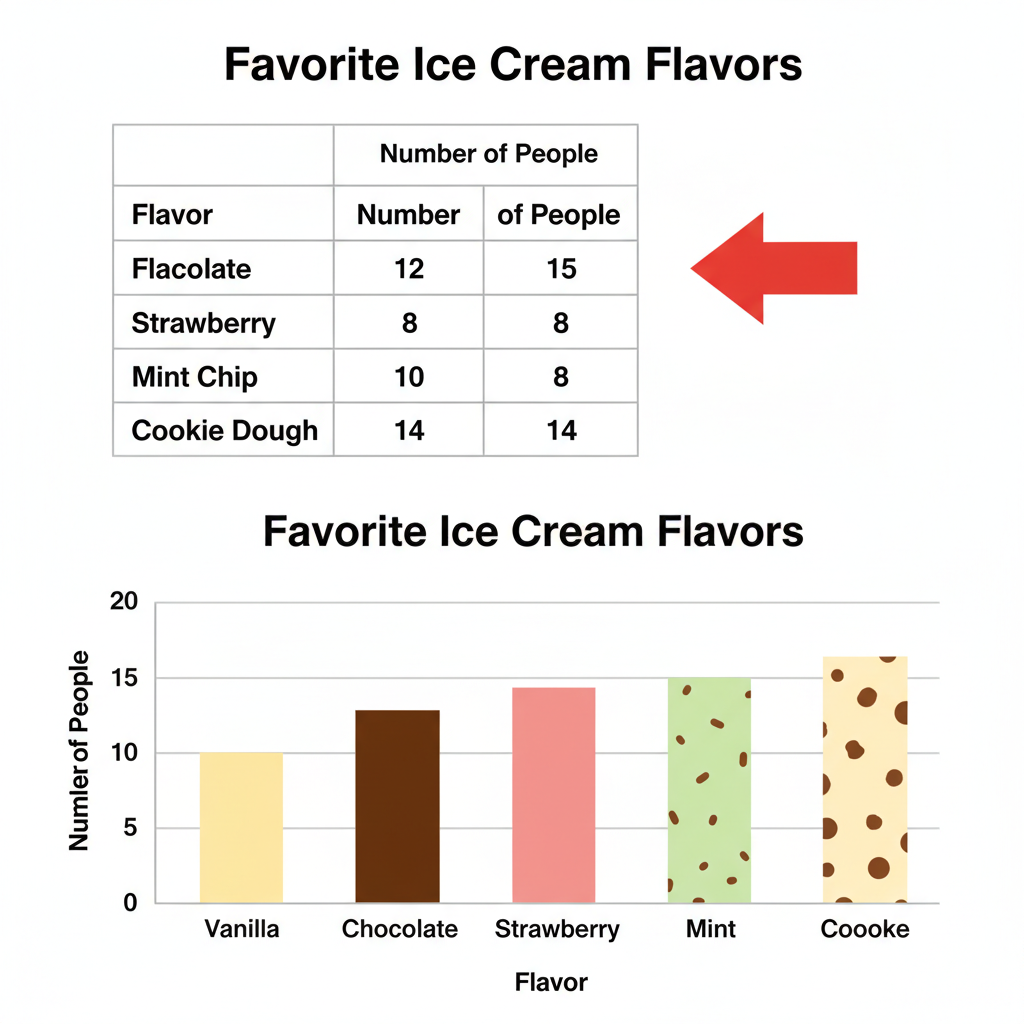 ⚠️ This picture may have spelling mistakes. Trust the words in the lesson.
Why are Bar Graphs So Handy?
Bar graphs make it super easy to compare things at a glance. You can quickly see which ice cream flavor is most popular (the tallest bar) and which is least popular (the shortest bar). It turns numbers into an easy-to-understand picture!
Now you're ready to start telling number stories with your very own bar graphs!
Keep learning, free
Create a free Syllabax account to unlock practice questions and games for this topic.
Visual Learning Enhanced! 🚀
To help you master this topic, we use Advanced Syllabax AI to generate detailed diagrams and visual models.
Note on Visuals: The AI sometimes makes spelling errors in image labels. Please refer to the lesson text for the correct terminology.