Box-and-Whisker Plots
Watch this topic in 60 seconds
Free preview · Lesson 1
Understanding Box-and-Whisker Plots
Understanding Box-and-Whisker Plots: A Foundational Guide (Grade 10)
Have you ever looked at a huge list of numbers, like test scores for a whole class, and felt overwhelmed? How do you quickly get a sense of how the class did? What was the typical score? What was the highest? The lowest? This is where a powerful tool called a Box-and-Whisker Plot (sometimes just called a Box Plot) comes in handy!
Imagine you're trying to describe a long road trip to a friend. You wouldn't list every single mile marker, right? Instead, you'd probably tell them where you started, where you ended, maybe the halfway point, and perhaps some interesting stops along the way. A Box-and-Whisker Plot does something similar for data – it gives us a quick, visual summary of the 'journey' our numbers take, showing us the spread and central tendency of a dataset without getting bogged down in every single data point.
What is a Box-and-Whisker Plot?
At its heart, a Box-and-Whisker Plot is a visual way to display the distribution of a set of data based on five key numbers. Think of it like a very concise 'report card' for your data, highlighting the most important statistics.
The 'Five-Number Summary' - The Pillars of a Box Plot
Every Box-and-Whisker Plot relies on five specific data points. Understanding these is like knowing the main characters in a story:
- Minimum Value: This is simply the smallest number in your entire dataset. It's the absolute bottom, the lowest point. Analogy: If your data were a ladder, the minimum value is the very first rung you step on.
- First Quartile (Q1): This is the median (middle) of the lower half of your data. If you split your ordered data exactly in half, Q1 would be the middle point of the first half. It marks the point below which 25% of your data falls. Analogy: If your data is a 100-meter race, Q1 is the 25-meter mark – one-quarter of the way through.
- Median (Second Quartile, Q2): This is the middle value of your entire dataset when the numbers are arranged in order. It divides your data into two equal halves. Half the data is above the median, and half is below. Analogy: The median is like the exact balancing point of a seesaw, or the exact halfway point of a bridge.
- Third Quartile (Q3): This is the median (middle) of the upper half of your data. It marks the point below which 75% of your data falls (or above which 25% of your data falls). Analogy: Continuing the race analogy, Q3 is the 75-meter mark – three-quarters of the way through.
- Maximum Value: This is the largest number in your entire dataset. It's the absolute top, the highest point. Analogy: It's the very last rung at the top of our ladder, or the finish line of our race.
Together, these five numbers help us understand the spread and center of our data. Think of them as the 'GPS coordinates' for mapping out your data's distribution.
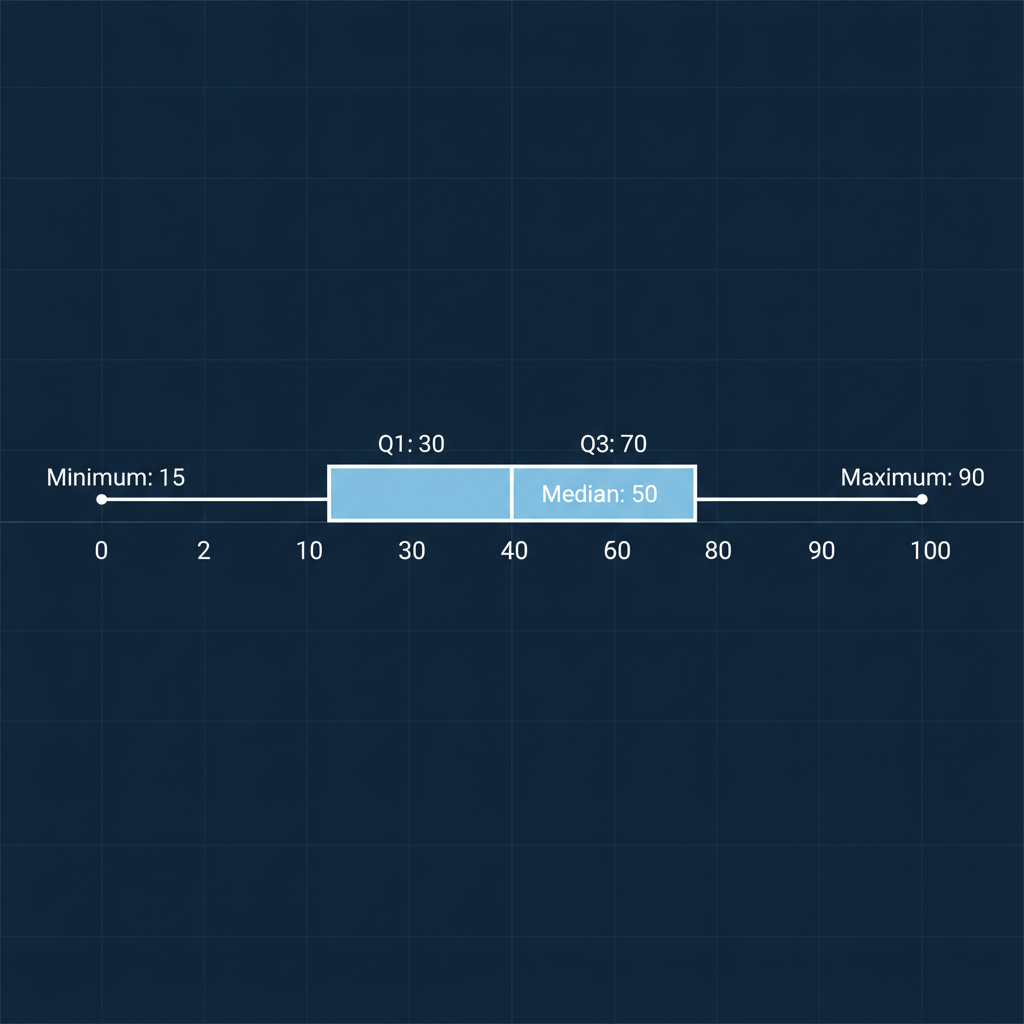
Deconstructing the Plot: The Box and The Whiskers
Once we have our five-number summary, we can draw the plot:
- The Box: This rectangular box stretches from Q1 to Q3. The length of the box represents the Interquartile Range (IQR), which is simply Q3 - Q1. This box is incredibly important because it shows you where the 'middle 50%' of your data lives. Analogy: If your data were a group of friends, the box represents the core group, the ones who are most 'alike' in their values. It's the 'meat' of your data, ignoring the very lowest and highest values.
- The Line Inside the Box: This line marks the Median (Q2). It doesn't always have to be in the exact middle of the box! If it's closer to Q1, it means the lower part of the middle 50% is more 'crunched' together. If it's closer to Q3, the upper part is more 'crunched'.
- The Whiskers: These are the lines (or 'whiskers') that extend from the edges of the box out to the minimum and maximum values. They show you the spread of the remaining 50% of your data, specifically the lowest 25% and the highest 25%. Analogy: The whiskers are like the 'outliers' or the 'extremes' of your friend group – the ones who are a bit different from the core, but still part of the group.
How to Create a Box-and-Whisker Plot (Step-by-Step)
Let's walk through an example. Imagine you have a list of the number of hours 10 students spent studying for a test: [5, 8, 3, 10, 7, 12, 4, 6, 9, 7]
-
Order Your Data: This is the crucial first step! Always arrange your numbers from smallest to largest.
[3, 4, 5, 6, 7, 7, 8, 9, 10, 12] -
Find the Minimum and Maximum Values:
- Minimum: 3
- Maximum: 12
-
Find the Median (Q2): This is the middle number. Since we have 10 data points (an even number), the median is the average of the two middle numbers.
The middle numbers are the 5th and 6th values: 7 and 7.
Median (Q2) = (7 + 7) / 2 = 7 -
Find Q1 (First Quartile): This is the median of the lower half of your data (excluding the median if your original dataset had an odd number of points). Our lower half is
[3, 4, 5, 6, 7]. The median of this half is 5.
Q1 = 5 -
Find Q3 (Third Quartile): This is the median of the upper half of your data. Our upper half is
[7, 8, 9, 10, 12]. The median of this half is 9.
Q3 = 9 - Draw a Number Line: Make sure your number line covers the entire range from your minimum to your maximum value. For our example, from 3 to 12.
- Mark the Five-Number Summary: Place a small dot or vertical line above the number line for 3 (Min), 5 (Q1), 7 (Median), 9 (Q3), and 12 (Max).
-
Draw the Box and Whiskers:
- Draw a box from Q1 (5) to Q3 (9).
- Draw a vertical line inside the box at the Median (7).
- Draw a 'whisker' from Q1 (5) to the Minimum (3).
- Draw a 'whisker' from Q3 (9) to the Maximum (12).
What Can a Box Plot Tell Us?
Reading a box plot is like understanding a visual story about your data:
- Central Tendency: The median line inside the box gives you a clear indication of the 'middle' or typical value in your data.
-
Spread/Variability:
- The total length of the plot (Max - Min) tells you the Range of your data – how spread out it is from end to end. Analogy: This is the total distance you travelled on your road trip.
- The length of the box (Q3 - Q1), which is the Interquartile Range (IQR), tells you how spread out the middle 50% of your data is. A small box means the middle values are very close together; a long box means they are more spread out. Analogy: This is the most 'dense' part of your road trip, where a lot of activity happened in a relatively short distance, or where things were very spread out.
- The length of the whiskers shows how spread out the lowest 25% and highest 25% are. Long whiskers mean there's a lot of spread at the extremes.
- Symmetry: If the median line is roughly in the middle of the box, and the whiskers are roughly the same length, your data might be fairly symmetrical. If the median is skewed to one side, or one whisker is much longer, it suggests the data is skewed in that direction. Analogy: If your seesaw is balanced, the data is symmetrical. If one side is heavier (more data points clustered), it's skewed.
Box-and-Whisker Plots are incredibly useful for comparing different datasets quickly, for example, comparing test scores between two different classes or showing how a stock's price varied over different months. They simplify complex information into an easy-to-understand visual summary!
Keep learning, free
Create a free Syllabax account to unlock practice questions and games for this topic.
Visual Learning Enhanced! 🚀
To help you master this topic, we use Advanced Syllabax AI to generate detailed diagrams and visual models.
Note on Visuals: The AI sometimes makes spelling errors in image labels. Please refer to the lesson text for the correct terminology.