Logical Inference from data -Data Interpretation (Foundation Level)
Watch this topic in 60 seconds
Free preview · Lesson 1
Logical Inference from data -Data Interpretation (Foundation Level) (Foundational)
Logical Inference from Data: Data Interpretation (Foundation Level)
Hello, young scientists! Today, we're going to become data detectives! We'll learn how to look at information (data) and figure out what it means. This is called data interpretation, and it's a super important skill in science and everyday life!
What is Data?
Data is just information. It can be numbers, words, pictures, or anything that tells us something. For example:
- The number of students in your class
- The colors of cars in the parking lot
- The height of plants in your garden
What is Data Interpretation?
Data Interpretation is when we look at data and try to understand what it means. It's like reading a secret code! We use the data to answer questions and make conclusions.
How to Interpret Data: Step-by-Step
- Look at the Data: First, carefully observe the data. What do you see? What numbers, colors, or words are there?
- Find Patterns: Look for things that repeat or trends in the data. Is something getting bigger or smaller? Are some things more common than others?
- Ask Questions: What questions can you answer using this data? For example, "Which color car is most popular?"
- Make Conclusions: Based on the patterns you see, try to answer your questions. This is making an inference, which means figuring something out based on the data.
Example: Favorite Fruits
Let's say we asked 10 students what their favorite fruit is. Here's the data we collected:
- Apple: 3 students
- Banana: 5 students
- Orange: 2 students
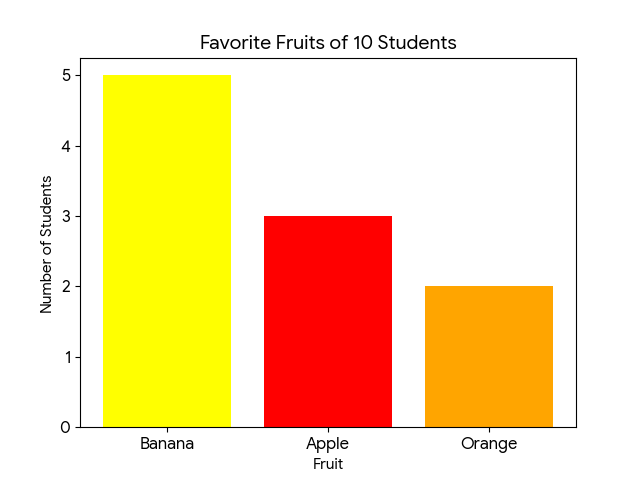 What can we infer from this data?
- Most students like bananas.
- Apples are more popular than oranges.
- No one chose grapes, watermelon, or any other fruits.
Different Ways to Show Data
Data can be shown in many ways:
- Tables: Organize data into rows and columns.
- Bar Graphs: Use bars to show how much of something there is.
- Pie Charts: Show how much of something there is compared to the whole thing.
Key Vocabulary
- Data: Information.
- Data Interpretation: Understanding what data means.
- Inference: Figuring something out based on data.
Remember, interpreting data is like being a detective! Keep asking questions and looking for patterns, and you'll become a data interpretation expert!
Keep learning, free
Create a free Syllabax account to unlock practice questions and games for this topic.
Visual Learning Enhanced! 🚀
To help you master this topic, we use Advanced Syllabax AI to generate detailed diagrams and visual models.
Note on Visuals: The AI sometimes makes spelling errors in image labels. Please refer to the lesson text for the correct terminology.