Introduction to Data Range
Watch this topic in 60 seconds
Free preview · Lesson 1
Understanding Introduction to Data Range
Introduction to Data Range: How Spread Out Are Our Numbers?
Hello, young mathematicians! Today, we're going on an exciting adventure into the world of numbers. We're going to learn about something called 'Data Range'. Don't let the big words scare you; it's actually super fun and easy, like finding the biggest and smallest toys in your toy box!
What is Data?
First, let's talk about 'data'. Data is just a fancy word for information or numbers that we collect. Think about it like this:
- If you count how many blue cars you see on the way to school, those numbers are data.
- If your teacher records everyone's height in your class, those heights are data.
- If you write down the scores you get in your favorite video game each day, those scores are data.
Data is everywhere! It's all the facts and figures we gather.
Let's imagine you and your friends counted how many books you read last month. Here are your counts:
- You: 5 books
- Sarah: 8 books
- Tom: 3 books
- Mia: 10 books
- David: 6 books
These numbers (5, 8, 3, 10, 6) are your data set!
 What is a Range? Why Do We Need It?
Now that we know what data is, let's learn about the 'range'. The range is a special number that tells us how 'spread out' our data is. It tells us the difference between the very biggest number and the very smallest number in our data set.
Imagine a Tug-of-War!
Think about a tug-of-war game. On one side, you have the biggest, strongest person pulling as hard as they can. On the other side, you have the smallest, lightest person pulling. The 'range' is like measuring the distance between where the strongest person pulls and where the lightest person pulls. It shows you the 'stretch' or 'spread' of the team!
Another Analogy: Temperature Today!
Let's say this morning it was a bit chilly, maybe 40 degrees. But by lunchtime, the sun came out, and it warmed up to 70 degrees! How much did the temperature change? That change is the range!
- Biggest temperature: 70 degrees
- Smallest temperature: 40 degrees
- Difference (Range): 70 - 40 = 30 degrees
The range tells us the temperature spread for the day was 30 degrees.
How Do We Find the Range? It's as Easy as 1-2-3!
Finding the range is super simple. You only need to follow three steps:
Step 1: Find the BIGGEST number!
Look at all the numbers in your data set and pick out the one that is the largest. This is like finding the tallest person in your class.
Step 2: Find the SMALLEST number!
Next, look at all the numbers again and find the one that is the tiniest. This is like finding the shortest person in your class.
Step 3: SUBTRACT the smallest from the biggest!
Once you have your biggest and smallest numbers, just subtract the smallest number from the biggest number. The answer you get is your range!
Let's Try an Example Together!
Remember our book-reading data from before: 5, 8, 3, 10, 6
- Biggest number: Look at 5, 8, 3, 10, 6. The biggest number is 10.
- Smallest number: Look at 5, 8, 3, 10, 6. The smallest number is 3.
- Subtract: Now, we subtract the smallest from the biggest: 10 - 3 = 7.
So, the range of books read by you and your friends is 7.
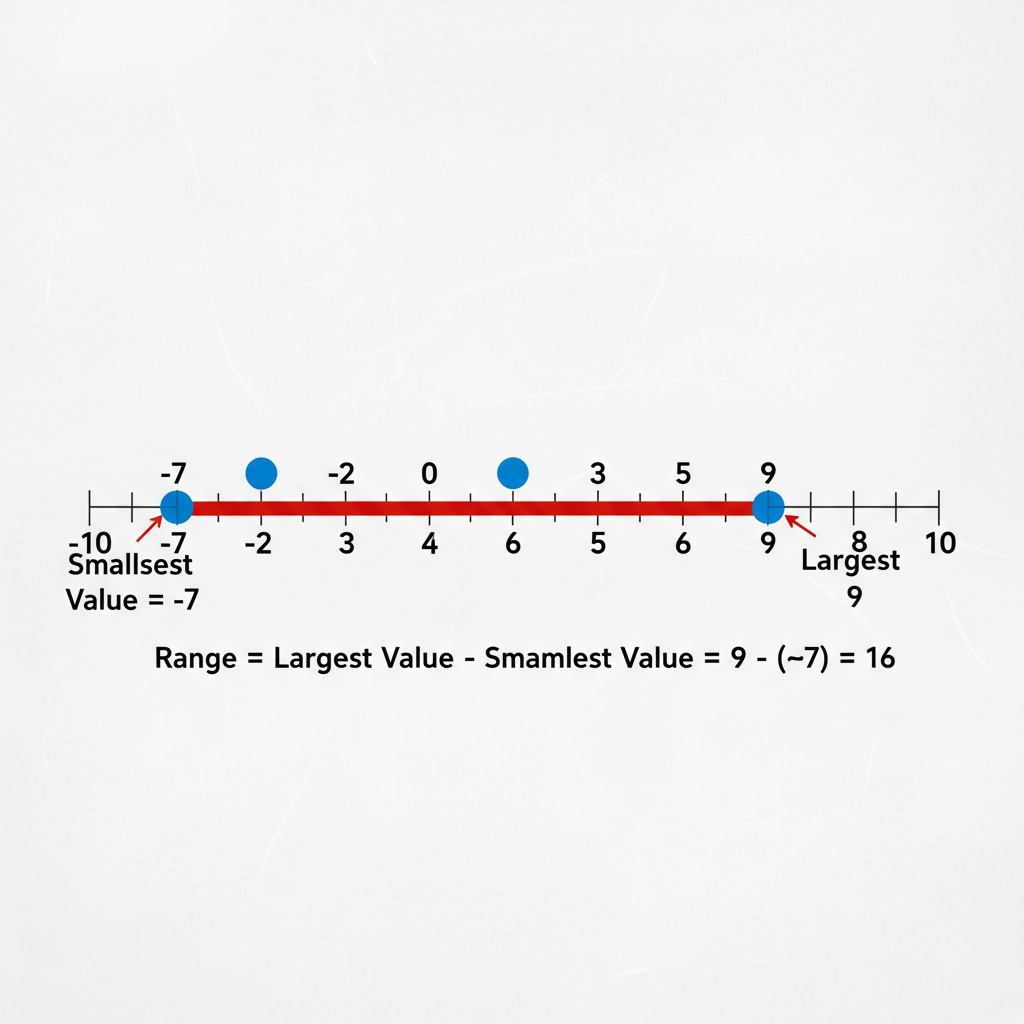 ⚠️ This picture may have spelling mistakes. Trust the words in the lesson.Why is the Range Useful?
The range helps us understand our data better. If the range is a big number, it means our data is very spread out, and the numbers are quite different from each other. If the range is a small number, it means our data is clustered together, and the numbers are pretty similar.
Think about ice cream cone prices:
- Store A: Small cone
- Store B: Small cone
See how the range tells us a lot about how different the prices are at each store?
So, next time you see a list of numbers, you'll know how to find its range and tell everyone how spread out that information is!
Keep learning, free
Create a free Syllabax account to unlock practice questions and games for this topic.
Visual Learning Enhanced! 🚀
To help you master this topic, we use Advanced Syllabax AI to generate detailed diagrams and visual models.
Note on Visuals: The AI sometimes makes spelling errors in image labels. Please refer to the lesson text for the correct terminology.