Bar graphs [Data Representation]
Watch this topic in 60 seconds
Free preview · Lesson 1
Understanding Bar graphs [Data Representation]
Understanding Bar Graphs: A Colorful Way to See Data!
Imagine you have a big box of colorful crayons. How would you know which color you have the most of? You could count them, right? But what if you had hundreds of crayons? Counting them all might take a while! This is where bar graphs come in handy. They are like super-organized crayon boxes that let us see information, or data, at a quick glance!
What is a Bar Graph?
A bar graph is a way to show information using long, skinny rectangles called bars. Think of these bars like stepping stones, where the height of each stone tells us how much of something we have. The taller the bar, the more there is! We use bar graphs to compare different things and see which one is the biggest, smallest, or somewhere in between.
Why Do We Use Bar Graphs?
Bar graphs help us make sense of numbers. They are like a secret code that turns a jumble of facts into a clear picture. Instead of reading through long lists of numbers, we can just look at the bars and understand the information easily. It's like looking at a weather map – you can see the sunny areas, cloudy areas, and rainy areas without reading a whole report!
Parts of a Bar Graph
Every good bar graph has a few important parts:
- Title: This tells us what the bar graph is all about. It's like the name of our crayon box, so we know what we're looking at. For example, a title could be "Favorite Colors of Class 5B".
- Labels: These are words that tell us what each bar represents. We usually have labels on the bottom (like the names of the colors) and on the side (like the number of students who chose that color).
- Axes: These are the lines that run across and up the graph. The horizontal line at the bottom is called the x-axis, and the vertical line on the side is called the y-axis. Think of them as the edges of our drawing paper.
- Bars: These are the rectangles we talked about. Each bar represents a category (like a color) and its height shows the amount or frequency of that category.
How to Read a Bar Graph
Reading a bar graph is like following a treasure map! Here's how you do it:
- Look at the Title: First, find out what the graph is about.
- Look at the Labels: See what categories are being compared (e.g., fruits, animals, favorite subjects) and what the numbers on the side represent (e.g., number of people, amount in kilograms, number of votes).
- Compare the Bars: Look at the height of each bar. The tallest bar shows the most of something, and the shortest bar shows the least.
- Find Specific Information: To find out exactly how much of something there is, look at the top of the bar and trace across to the number on the y-axis.
Example: Favorite Fruits in Class 5B
Let's imagine our class voted for their favorite fruits. Here’s how a bar graph might show it:
Title: Favorite Fruits of Class 5B
x-axis Labels: Apple, Banana, Orange, Strawberry
y-axis Labels: Number of Students (from 0 to 10)
Imagine bars showing:
- Apple: Reaches up to the number 5 on the y-axis.
- Banana: Reaches up to the number 8 on the y-axis.
- Orange: Reaches up to the number 3 on the y-axis.
- Strawberry: Reaches up to the number 6 on the y-axis.
From this bar graph, we can quickly see:
- Bananas are the favorite fruit (tallest bar).
- Oranges are the least favorite fruit (shortest bar).
- More students like apples than oranges.
- We can even tell exactly: 8 students like bananas, 5 like apples, 6 like strawberries, and 3 like oranges.
Types of Bar Graphs
There are different ways to draw bar graphs. Sometimes the bars go up and down (vertical), and sometimes they go side to side (horizontal). For our learning, we will mostly look at the ones that go up and down, like stepping stones to the sky!
Vertical Bar Graph: The bars stand up tall, like skyscrapers, showing increases. This is what we used in our favorite fruit example.
Horizontal Bar Graph: The bars lie down, like a train on a track. These are often used when you have very long labels for the categories.
When Are Bar Graphs Used?
Bar graphs are used everywhere! Your teachers might use them to show class test scores, or scientists might use them to compare the heights of different mountains. Your parents might see them in newspapers showing how much money companies made, or how many people voted in an election. They are a super useful tool for understanding the world around us.
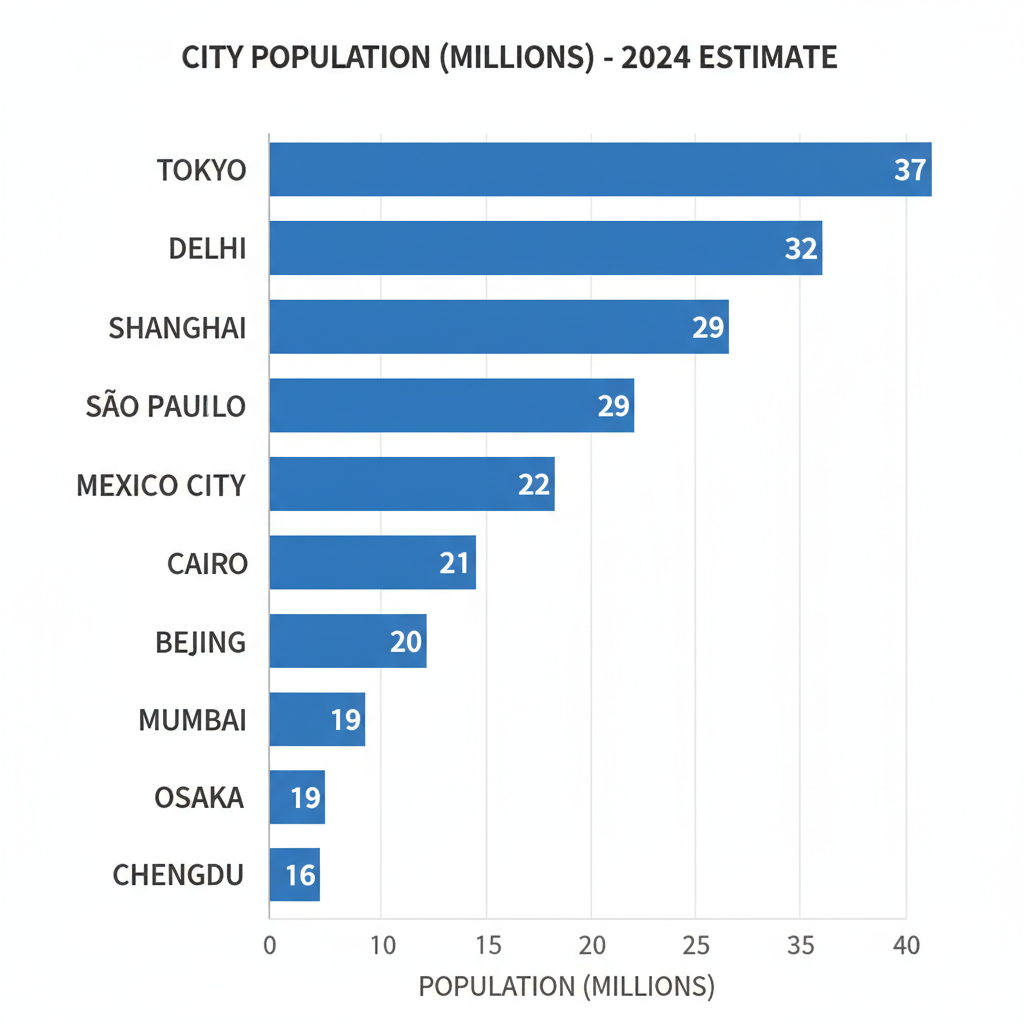 ⚠️ This picture may have spelling mistakes. Trust the words in the lesson.
Let's Practice!
Now that you know about bar graphs, let's try to read one and answer some questions. Remember, the taller the bar, the more there is!
Keep learning, free
Create a free Syllabax account to unlock practice questions and games for this topic.
Visual Learning Enhanced! 🚀
To help you master this topic, we use Advanced Syllabax AI to generate detailed diagrams and visual models.
Note on Visuals: The AI sometimes makes spelling errors in image labels. Please refer to the lesson text for the correct terminology.