Picture Graphs: Introduction
Watch this topic in 60 seconds
Free preview · Lesson 1
Understanding Picture Graphs: Introduction
Unlocking the Story: An Introduction to Picture Graphs!
Hey there, future data detectives! Have you ever had a pile of toys all over your room? It's hard to find your favorite action figure or that special building block when everything is a big mess, right? Well, numbers and information (we call this "data") can be just like that messy toy pile!
Imagine you wanted to tell your friend how many different kinds of snacks you have, or how many pets each person in your family owns. If you just said, "I have 3 apples, 2 bananas, 5 cookies, and 1 orange," it might be a bit hard to remember everything. What if there was a super fun, super easy way to show all this information at once, almost like tidying up your messy toy room?
What's a Graph? Your Data's Map!
That's where graphs come in! Think of a graph like a special kind of map. A regular map shows you where roads, rivers, and cities are. A graph, however, shows you where numbers and information are! It helps us see patterns and compare things much more easily than just looking at a long list of numbers.
There are many different kinds of graphs, but today, we're going to explore one of the most exciting and colorful: Picture Graphs!
Picture Graphs: Data with a Splash of Fun!
Just like their name suggests, picture graphs use pictures or symbols to show information. Instead of writing "5 apples," a picture graph might show five little apple drawings! It's like telling a story with pictures instead of just words.
Think of it like playing a board game. Each little game piece, or token, represents something important in the game. In a picture graph, each picture is like a token representing a certain amount of data.
The Super Important Parts of a Picture Graph (Your Secret Decoder Ring!)
Every good picture graph has a few key ingredients, and understanding them is like having a secret decoder ring for understanding the data! Let's break them down:
-
Title: What's the Story About?
Just like a book has a title that tells you what the book is about, a picture graph has a title. The title tells you exactly what kind of information you're looking at. For example, "Favorite Fruits of Mrs. Lee's Class" or "Number of Pets Owned by Students." It's the first thing you should always read!
-
Categories/Labels: Who or What Are We Counting?
These are the different groups or items that you are comparing or counting. If you're counting favorite fruits, your categories might be "Apples," "Bananas," "Oranges," and "Grapes." If you're counting pets, the categories might be "Dogs," "Cats," "Fish," and "Birds." They tell you what each row or column of pictures represents.
-
Pictures/Symbols: The Little Stars of the Show!
These are the actual drawings or images used to represent the data. If the graph is about favorite fruits, the pictures might be drawings of apples, bananas, etc. If it's about pets, they might be drawings of dogs, cats, etc. These are what you'll be counting!
-
👉 The KEY (or Legend): The SUPER-DUPER Most Important Part! 👈
This is like the secret code to understanding the whole graph! The key tells you what each single picture stands for. Sometimes, one picture stands for just '1' item. But other times, one picture might stand for '2' items, '5' items, or even '10' items! Without checking the key, you might count incorrectly. It's like finding a treasure chest, but you need the key to know how much treasure is inside each coin! Always, always, always look at the key first!
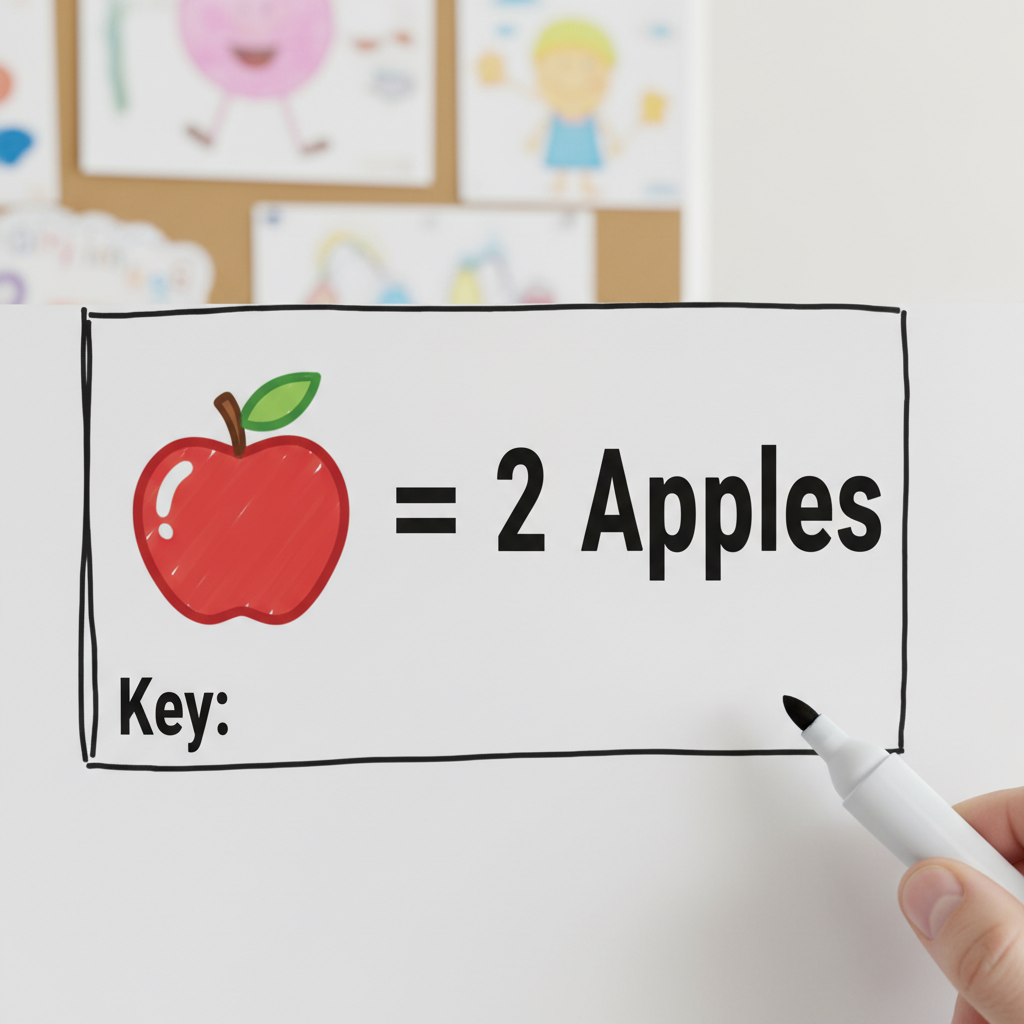
For example, a key might say: " 🍎 = 2 Apples." This means if you see three apple pictures in a row, it doesn't mean 3 apples, it means 3 x 2 = 6 apples!
Let's Read a Picture Graph Together!
Ready to put on your data detective hat? Here’s how you can read any picture graph:
- Step 1: Read the Title. What is the graph trying to tell you?
- Step 2: Look at the Categories. What different things are being compared?
- Step 3: 👉 Find the KEY! 👈 What does each picture symbol represent? This is your magic decoder!
- Step 4: Count the Pictures for Each Category. Multiply the number of pictures by the value given in the key.
- Step 5: Ask Questions! Now you can easily answer questions like "Which category has the most?" or "How many more of this than that?"
An Example to Make it Crystal Clear: Favorite Seasons!
Let's imagine our class voted on their favorite season. Here's what our picture graph might look like:
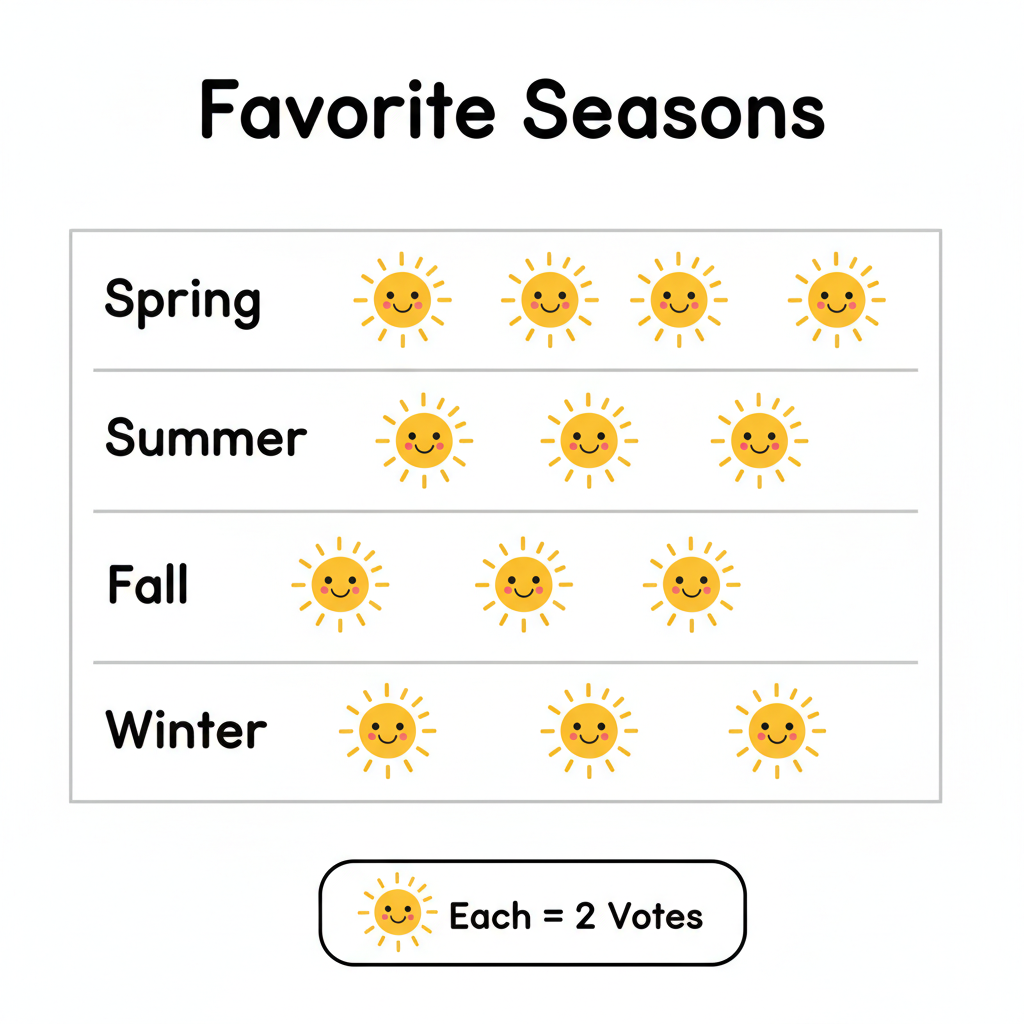
Let's use our steps to read it:
- Title: "Favorite Seasons of Grade 5 Students" – Okay, we know it's about seasons and our class!
- Categories: Spring, Summer, Fall, Winter – These are the four choices.
- The Key: Ah, here it is! Let's say our key says: " ☀️ = 2 Students". This means every little sun drawing counts for TWO students, not just one!
-
Count and Calculate:
- Spring: Let's say there are 3 suns. So, 3 x 2 = 6 students like Spring.
- Summer: Let's say there are 5 suns. So, 5 x 2 = 10 students like Summer.
- Fall: Let's say there are 2 suns. So, 2 x 2 = 4 students like Fall.
- Winter: Let's say there are 4 suns. So, 4 x 2 = 8 students like Winter.
-
Ask Questions:
- Which season is most popular? Summer (10 students).
- Which season is least popular? Fall (4 students).
- How many more students like Summer than Spring? 10 - 6 = 4 students.
Why Are Picture Graphs So Great?
Picture graphs are awesome because:
- They are super easy and fun to read, especially when you're just starting to learn about data.
- The pictures make it simple to compare different categories at a glance.
- They turn boring numbers into exciting visual stories!
So next time you see a picture graph, remember your secret decoder ring (the key!) and get ready to uncover the story the data is trying to tell you!
Keep learning, free
Create a free Syllabax account to unlock practice questions and games for this topic.
Visual Learning Enhanced! 🚀
To help you master this topic, we use Advanced Syllabax AI to generate detailed diagrams and visual models.
Note on Visuals: The AI sometimes makes spelling errors in image labels. Please refer to the lesson text for the correct terminology.