Reading Information from Line Plots
Watch this topic in 60 seconds
Free preview · Lesson 1
Understanding Reading Information from Line Plots
Welcome, Junior Data Detectives! Decoding Line Plots
Hello, amazing 4th graders! Today, we're going on an exciting adventure to become super smart at reading 'Line Plots.' Imagine you're a detective trying to figure out how many pets everyone in your class has, or how many times your friends bounced a ball in a minute. A line plot is like a special secret map that helps us see all this information clearly and quickly, without getting lost in a jumble of numbers!
What is a Line Plot? Your Data's Tally Chart!
Think of a line plot like a special kind of chart or a 'data shelf.' It uses a number line (just like the one you use on a ruler in math class!) and little 'X's (or sometimes dots) to show how often something happens. It's super helpful when we want to see a lot of information in a simple, easy-to-understand way.
Analogy Time! Imagine you have a row of empty shelves in your classroom, and each shelf is labeled with a number (like 0, 1, 2, 3, 4, 5). When someone says they have 2 pets, you put a block on the shelf labeled '2.' If another person also has 2 pets, you stack another block on top of the first one on the '2' shelf. A line plot does something very similar, but it uses 'X's instead of blocks! Each 'X' is like one block or one vote for that number.
The Secret Parts of a Line Plot
Every good detective knows to look for clues! A line plot has a few important parts that act like clues to help us understand the data.
-
The Title: What's the Story About?
Every good book or story has a title, and so does every line plot! The title tells you exactly what information the line plot is showing. Is it about 'Number of Books Read by Class 4A' or 'Heights of Sunflowers in Our Garden'? The title is your very first clue – it tells you what mystery you're trying to solve! -
The Number Line: The Foundation of Our Data!
This is the straight line at the bottom, just like the number line you use to count. It shows all the possible answers or measurements. For example, if we're talking about 'Number of Pets,' the line might go from 0 up to 5, showing that people could have 0, 1, 2, 3, 4, or 5 pets. Think of it as the 'foundation' or the 'ground floor' of our data building. Each number on the line is a possible category. -
The X's (or Dots): The Data Points!
These are the most important stars of the show! Each 'X' (or sometimes a dot) you see above a number on the line means that value happened one time. If you see three 'X's stacked up above the number '2,' it means three people had '2' of something (like 2 pets, or scored 2 points in a game). The 'X's are like tally marks, but stacked up neatly! They show us how many 'votes' each number got, or how many times a specific measurement appeared. -
The Label: What Do the Numbers Mean?
Sometimes, right under the number line, there's a small label that tells you what the numbers actually mean. Is it 'Number of Books,' 'Inches,' 'Hours,' or 'Number of Siblings'? This label is super important, like a tag on a toy, telling you exactly what it is. It helps you understand the units of your data.
How to Read a Line Plot – Being a Data Detective!
Now that we know the parts, let's put on our detective hats and learn how to read these plots!
- Step 1: Read the Title! Always start here. What is this line plot trying to tell you?
- Step 2: Look at the Number Line and its Label! What are the numbers representing? What are the possible answers or measurements?
- Step 3: Count the X's! For each number on the line, count how many 'X's are stacked above it. Each 'X' is one piece of information. This tells you 'how many' for each category.
- Step 4: Answer Questions! Once you've counted the 'X's, you can answer all sorts of questions!
- "Which number has the most X's?" (This is the most common answer, or the 'mode'.) Imagine a skyscraper with the most floors! That's the most popular or frequent answer.
- "Which number has the least X's?" (The least common answer, or data that didn't happen much.) This is the shortest building on our data street, or even an empty lot if there are no X's!
- "How many X's are there in total?" (Just count all the X's on the whole plot!) This tells you how many pieces of information were collected in total, or how many people were asked. This is like counting all the items on all the shelves.
- "What is the range?" The range is the difference between the biggest number shown with an 'X' and the smallest number shown with an 'X'. For example, if someone has 5 pets and someone else has 1 pet, the range is 5 - 1 = 4. It tells you how spread out the data is.
Example Time! Let's Solve a Mystery Together!
Imagine your teacher asked everyone in your class how many hours they spent reading last weekend. Here's what the line plot looks like:
Let's use our detective skills!
- Title: "Hours Spent Reading Last Weekend" (Aha! So we're looking at reading time!)
- Number Line: Goes from 0 to 5. The label (implied or written below) is 'Hours'.
Now, let's count the X's for each number:
- 0 hours: There are 2 X's. So, 2 students read 0 hours.
- 1 hour: There are 3 X's. So, 3 students read 1 hour.
- 2 hours: There are 5 X's. So, 5 students read 2 hours.
- 3 hours: There are 4 X's. So, 4 students read 3 hours.
- 4 hours: There is 1 X. So, 1 student read 4 hours.
- 5 hours: There are 0 X's (no X's!). So, 0 students read 5 hours.
Time for some detective questions based on this plot!
- Question: How many students spent exactly 2 hours reading?
Answer: Look above the '2'. There are 5 X's, so 5 students! - Question: What was the most common number of hours spent reading?
Answer: Which number has the most X's? The number '2' has 5 X's, which is the most. So, 2 hours! - Question: How many students spent 3 or more hours reading?
Answer: Count the X's above '3' and '4': 4 X's + 1 X = 5 students! - Question: How many students were asked in total for this survey?
Answer: Count all the X's on the whole plot: 2 + 3 + 5 + 4 + 1 = 15 students!
Why are Line Plots Super Useful?
Line plots are like magic glasses for data! They help us:
- See information clearly at a glance.
- Quickly find the most and least common things.
- Compare different numbers and categories easily.
- Understand patterns and groups in the data.
It's much easier to understand information from a line plot than from a long list of numbers. Imagine trying to find the most popular ice cream flavor just from a list of 100 people's choices. A line plot makes it a snap!
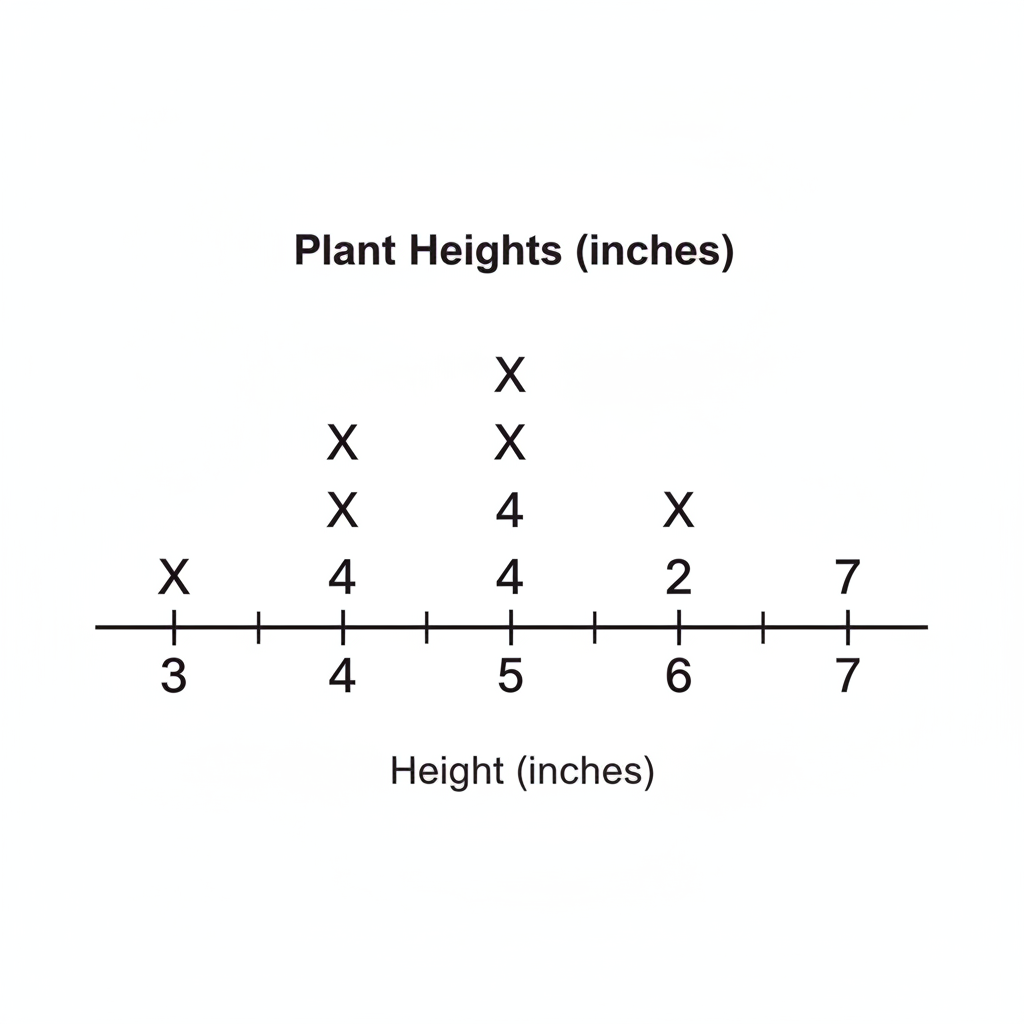 ⚠️ This picture may have spelling mistakes. Trust the words in the lesson.
Here's another example! This plot might show 'Heights of Plants in Inches'. You can quickly see most plants are 5 inches tall (4 X's), and no plants are 7 inches tall (0 X's)! One plant is 3 inches tall. It's a quick way to see the 'picture' of the data.
Great Job, Data Detectives!
You now know how to read and understand line plots. They are a powerful tool to make sense of numbers and information all around us, from surveys about favorite colors to tracking how many times you practice your multiplication facts. Keep practicing, and you'll be a data master in no time!
Keep learning, free
Create a free Syllabax account to unlock practice questions and games for this topic.
Visual Learning Enhanced! 🚀
To help you master this topic, we use Advanced Syllabax AI to generate detailed diagrams and visual models.
Note on Visuals: The AI sometimes makes spelling errors in image labels. Please refer to the lesson text for the correct terminology.