Reviewing Our Data Skills
Watch this topic in 60 seconds
Free preview · Lesson 1
Understanding Reviewing Our Data Skills
Reviewing Our Data Skills: Becoming Data Detectives!
Hello, young data detectives! Today, we're going on an exciting adventure to review our amazing data skills. Think of data as tiny clues that help us solve big mysteries and understand the world around us. Just like a detective needs to gather clues to solve a case, we need to gather data to understand things better!
What is Data? The Clues to Our World!
Imagine you're trying to figure out what your classmates' favorite colors are, or how many pets everyone has. The answers to these questions are what we call data. Data are simply pieces of information or facts. They can be numbers, words, or observations. Think of data like the ingredients for a delicious cake – each ingredient (like flour, sugar, or eggs) is a piece of data. By putting them together, we get the whole cake, which is our understanding!
- Examples of data:
- The number of sunny days last month.
- Your friends' favorite fruits.
- How many push-ups you can do.
- The different kinds of birds you see in your backyard.
Why Do We Care About Data? The Power of Understanding!
Why bother collecting all these clues? Because data helps us make sense of things and make smart choices! If you know that most of your friends like to play tag, you'll choose tag for recess. If you know that it rains a lot in April, you'll bring an umbrella. Data helps us:
- Understand: What's happening?
- Compare: Which is more? Which is less?
- Predict: What might happen next?
- Decide: What's the best choice to make?
It's like having a superpower that lets you see hidden patterns and make predictions!
Collecting Data: Being a Super Sleuth!
Before we can understand data, we need to gather it! There are many ways to collect data, just like there are many ways to find clues:
-
Asking Questions (Surveys):
This is like asking someone directly for a clue. When you ask people questions to get their opinions or facts, you're conducting a survey! For example, asking all your classmates, "What is your favorite animal?" is a survey. You might get answers like 'cat,' 'dog,' 'fish,' or 'turtle.'
Analogy: Imagine you're trying to decide what movie to watch with your family. You ask everyone, "What kind of movie do you want to watch?" The answers you get are data collected through a survey!
-
Observing:
Sometimes, we just watch and count what we see. You don't ask questions; you just look carefully. For instance, counting how many red cars drive past your school in 10 minutes, or how many birds visit the bird feeder in an hour. You're being a silent, watchful data collector!
Analogy: It's like watching a sports game and keeping track of how many baskets your favorite player scores. You're observing their actions and collecting data.
-
Measuring:
This involves using tools to find out facts. You might use a ruler to measure the height of different plants, a thermometer to measure the temperature each day, or a measuring cup to see how much water is in a bottle. Numbers are often a big part of data collected by measuring.
Analogy: If you want to know how tall you are, you use a measuring tape. That number (your height) is a piece of data you collected by measuring!
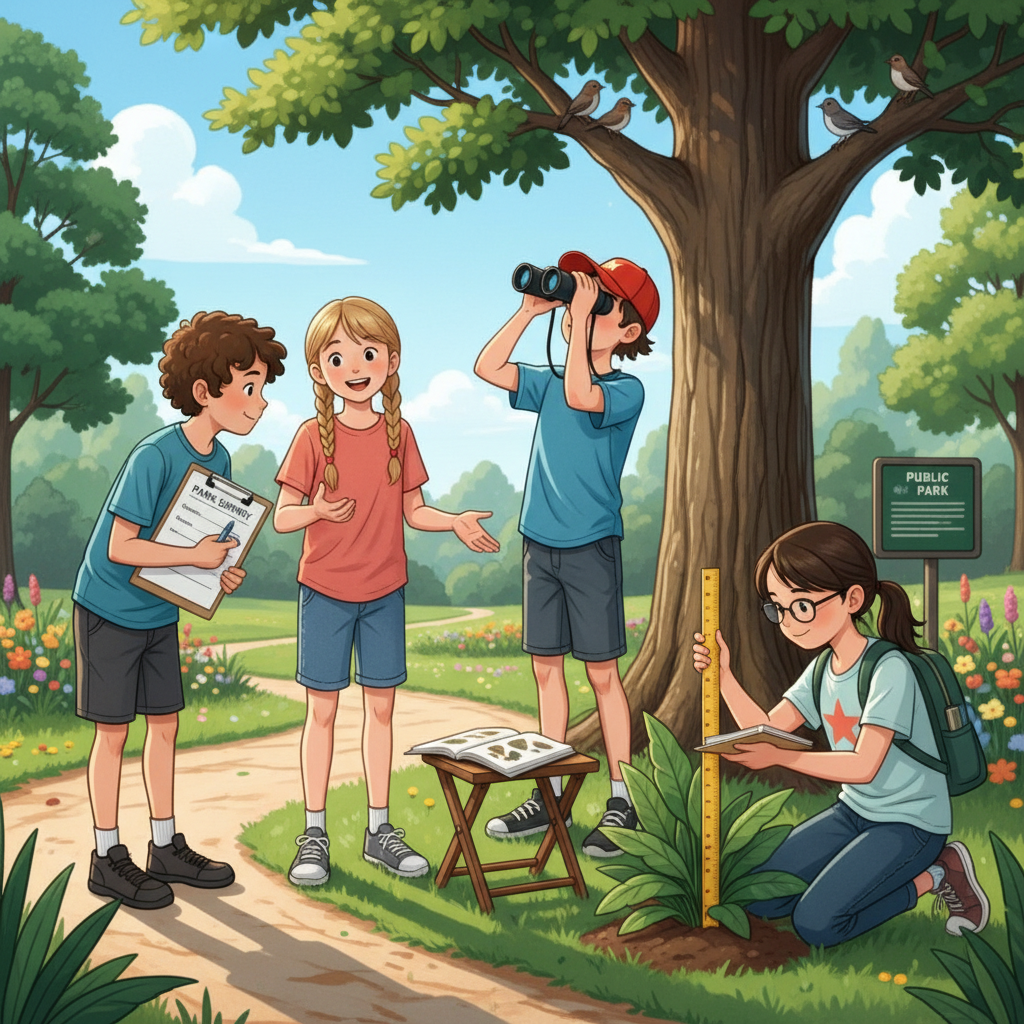
These are the tools in your data detective kit! Once you've collected your data, it's time to make it tidy.
Organizing Data: Tidying Up Our Clues!
Imagine you've collected a huge pile of toys. If they're all over the floor, it's hard to find what you want! Data is the same. After collecting it, we need to organize it so we can understand it better. Here are two super helpful ways:
-
Tally Charts:
A tally chart is a quick way to count things and keep track. For every time something happens, you make a little mark (a tally mark). When you get to four marks, the fifth one crosses the first four. This helps you count by fives easily!
Analogy: It's like keeping score in a game. Every time a team scores a point, you make a mark. Once you have four marks, you draw a line through them to make a group of five, making it easy to see the score quickly.
Example: Favorite Colors of Classmates
Color Tally Total Blue |||| || 7 Red |||| 5 Green ||| 3 Yellow |||| | 6 -
Tables:
Tables are like neatly organized shelves in a closet. They have rows and columns that help us sort information clearly. Each row or column usually has a label so you know exactly what you're looking at.
Analogy: Think of a daily schedule. It has columns for 'Time' and 'Activity,' and rows for each part of your day. Everything is neat and easy to find!
Example: Number of Pets in Our Class
Type of Pet Number of Students Dog 10 Cat 8 Fish 5 Bird 2
Representing Data: Telling the Data's Story!
Once our data is organized, we can turn it into pictures! These pictures are called graphs, and they make it super easy to see patterns, compare amounts, and understand the data's story at a glance. It's like turning a pile of puzzle pieces into a beautiful completed picture!
-
Bar Graphs:
Bar graphs use bars (rectangles) to show how much of something there is. The longer or taller the bar, the greater the amount. They are great for comparing different categories.
- Parts of a Bar Graph:
- Title: Tells what the graph is about. (e.g., "Favorite Sports")
- Labels: Tell what each bar and axis represents. (e.g., 'Sports,' 'Number of Students')
- Scale: The numbers along the side (usually starting at zero) that tell you how much each step on the bar represents. (e.g., 0, 1, 2, 3...)
Analogy: Imagine a city skyline. Each building (bar) represents a different type of data, and its height tells you how much of that data there is. A tall building means a lot, a short one means a little.
-
Pictographs:
Pictographs use pictures or symbols to represent data. Each picture usually stands for a certain number of things. For example, one picture of a happy face might mean 2 students.
- Key: This is super important for a pictograph! It tells you what each picture or symbol stands for (e.g., "Each 😀 = 5 books"). Without the key, you can't read the story!
Analogy: It's like a secret code! Each secret symbol in the code stands for something specific. You need the 'key' to unlock the secret message.
-
Line Plots (Dot Plots):
Line plots, also called dot plots, show data along a number line. For each piece of data, you put an 'X' or a dot above its number on the line. They are great for showing how often certain numbers appear.
Analogy: Imagine a classroom where students have different numbers of pencils. For each student, you put an 'X' above the number that matches how many pencils they have. You can quickly see which number of pencils is most common!
Example: Number of Books Read Last Month
XX XX X X------------------0 1 2 3 4 5
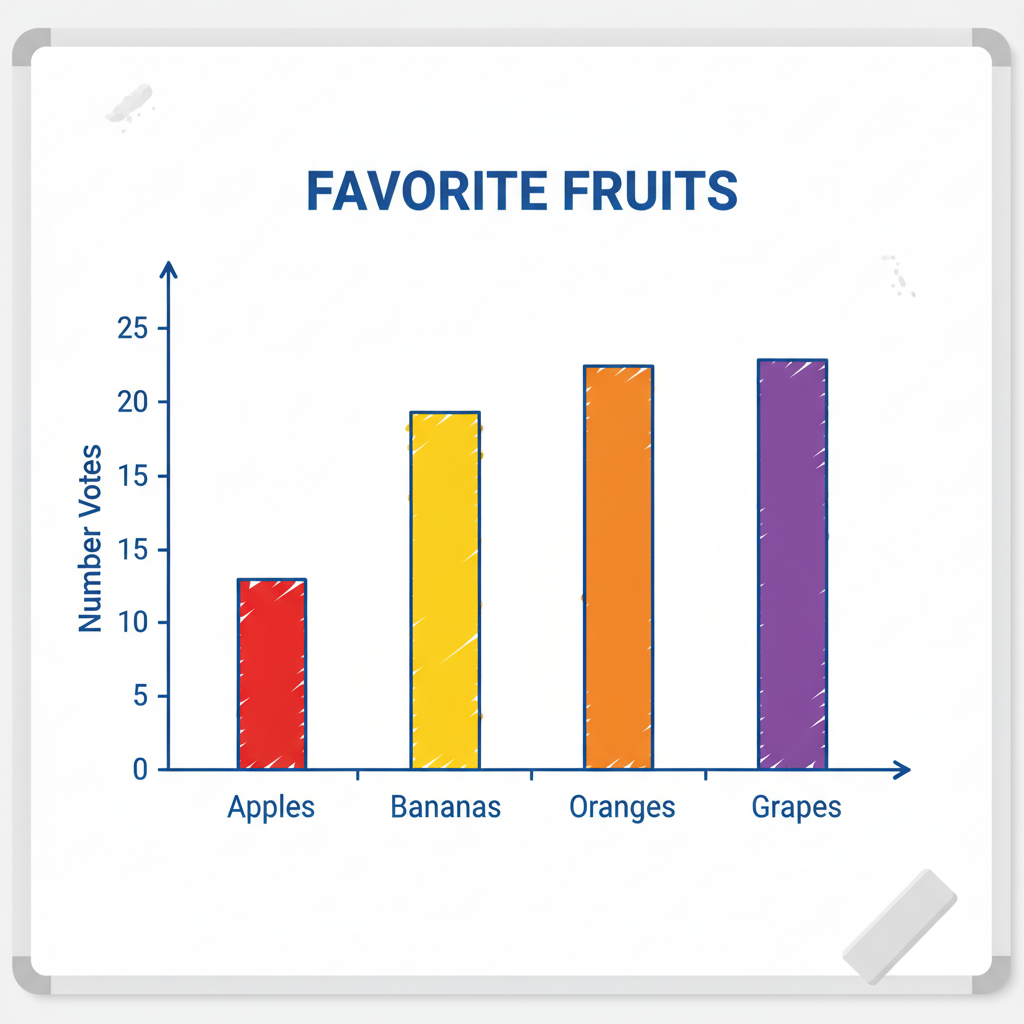 ⚠️ This picture may have spelling mistakes. Trust the words in the lesson.
Graphs help our brains quickly understand lots of information!
Interpreting Data: Reading the Story and Making Discoveries!
This is where we become true data detectives! Interpreting data means looking at our organized data and graphs and figuring out what they tell us. It's like reading a story and understanding what happened, who the characters are, and why things occurred.
When you interpret data, you ask questions like:
- Which category has the most? (The tallest bar? The most pictures? The most 'X's?)
- Which category has the least?
- What is the difference between the most and the least?
- Are there any patterns? (Are most of the 'X's grouped together? Does one bar stand out?)
- What conclusions can I make? (e.g., "More students prefer dogs than cats," or "Most students read 3 books last month.")
Analogy: Think of a treasure map. The map (our graph) shows you where different treasures are. Interpreting the map means figuring out which spot has the most treasure, which has the least, and where you should dig first! You're finding the valuable insights hidden within the data.
You're a Data Expert!
Congratulations, future data scientists! You've reviewed how to collect data, organize it, show it in different ways, and understand its story. These skills are super important for school, for games, and for understanding the world around you every single day. Keep practicing your data detective skills, and you'll uncover amazing things!
Keep learning, free
Create a free Syllabax account to unlock practice questions and games for this topic.
Visual Learning Enhanced! 🚀
To help you master this topic, we use Advanced Syllabax AI to generate detailed diagrams and visual models.
Note on Visuals: The AI sometimes makes spelling errors in image labels. Please refer to the lesson text for the correct terminology.