Creating Pictographs
Watch this topic in 60 seconds
Free preview · Lesson 1
Understanding Creating Pictographs
Unlocking the Story: Creating Pictographs (Grade 7)
Hey there, future data detectives! Have you ever seen a chart that uses little pictures instead of just numbers? That, my friends, is a pictograph! It's like telling a story with pictures, which can be super helpful for understanding information quickly and clearly. Think of it like using emojis to express how you feel – a single emoji can say a lot without needing many words!
What is a Pictograph?
Imagine you're trying to tell your friend how many different kinds of pets people in your class own. You could list out all the numbers, but what if you could *show* them? A pictograph is a type of graph that uses symbols or pictures to represent data. Each picture stands for a certain number of items. It's like a secret code where each little drawing holds a special numerical meaning.
Why Do We Use Pictographs?
- Easy to Understand: They make numbers less intimidating and easier to 'see' at a glance.
- Visually Appealing: Pictures grab attention and make data more interesting.
- Quick Comparisons: You can easily compare different categories by just looking at the length of the rows of pictures.
The Essential Parts of a Pictograph (The 'Must-Haves'):
Every good pictograph needs a few key ingredients to make sense. Think of it like baking a cake – you need flour, sugar, and eggs, right? For a pictograph, you need these:
1. The Title: What's the Story About?
Just like a book needs a title, your pictograph needs one too! The title tells everyone exactly what the graph is showing. It should be clear, concise, and give a hint about the data. For example, 'Favorite Ice Cream Flavors of 7th Graders' is much better than just 'Ice Cream'.
2. The Data: The Numbers Behind the Pictures
Before you can draw any pictures, you need to know what you're counting! This is your data – the information you've collected. Maybe it's how many students prefer dogs, cats, or hamsters, or how many pizzas were sold each day of the week.
3. The Categories/Labels: What Are We Comparing?
Your pictograph will usually have different rows or columns, each representing a different category. These are your labels. If you're showing favorite fruits, your labels might be 'Apples', 'Bananas', 'Oranges', etc. They help organize your data so it's easy to see which pictures belong to which group.
4. The Symbol: The Picture That Represents a Number
This is the fun part! You choose a simple picture or icon to represent your data. For example, if you're counting apples, you might use a picture of an apple. If you're counting cars, you might use a picture of a car. But here's the trick: one symbol doesn't always mean one item!
Imagine you're counting how many students walked to school each day. If 100 students walked on Monday, drawing 100 little stick figures would take forever! Instead, you can decide that *one* stick figure symbol will represent, say, 10 students. This makes your pictograph much neater and easier to read.
Analogy: Think of money! A single dollar bill ('$1') doesn't just represent one penny; it represents 100 pennies. Or a five-dollar bill represents five individual dollars. Your symbol works the same way – it's a 'bill' that represents a certain quantity of the actual item.
5. The Key (or Legend): The Rulebook for Your Symbols
This is arguably the most important part! The key (sometimes called a legend) is like a mini-dictionary for your pictograph. It tells everyone exactly what each symbol represents. If your apple symbol stands for 5 apples, your key *must* say: '🍎 = 5 Apples'. Without a key, your pictograph is just a bunch of pretty pictures with no meaning!
Analogy: Imagine trying to read a map without a legend! You wouldn't know if a squiggly line means a river or a road, or if a little tree icon means a forest or just one lonely tree. The key for your pictograph is just as crucial.
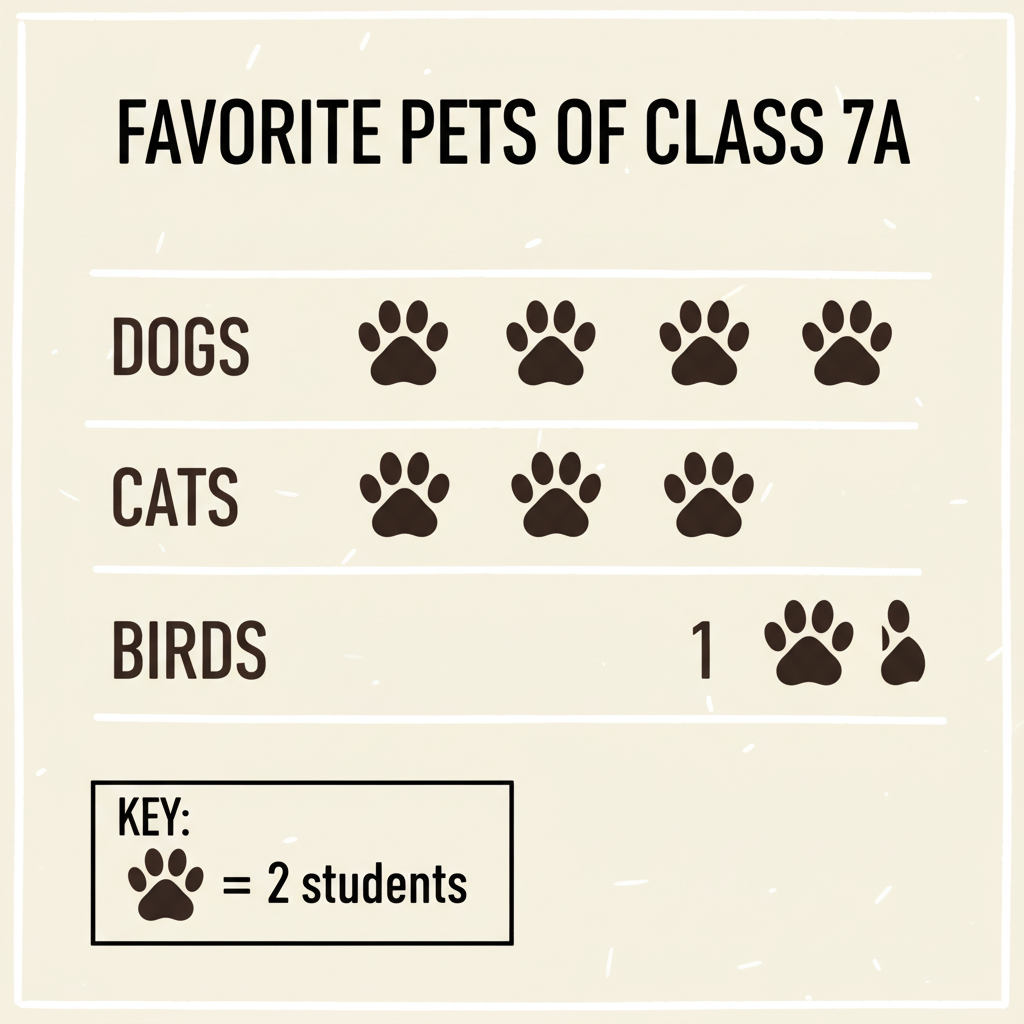 ⚠️ This picture may have spelling mistakes. Trust the words in the lesson.
An example showing all the essential parts of a pictograph: title, categories, symbols, and a clear key.
How to Create Your Own Awesome Pictograph (Step-by-Step Guide):
Let's put it all together! Here's how you can make your very own pictograph:
Step 1: Gather Your Data!
First things first: what are you counting? Collect your information. For example, let's say we asked 7th graders about their favorite colors, and the results are:
- Blue: 10 students
- Green: 8 students
- Red: 6 students
- Yellow: 4 students
Step 2: Choose Your Symbol!
Pick a simple, clear picture that relates to your data. Since we're talking about colors, maybe a paintbrush or a colored dot? Let's go with a simple colored circle (🎨).
Step 3: Decide on Your Key (How Much Does Each Symbol Represent)?
Look at your data. You have numbers like 10, 8, 6, and 4. What's a good number that divides evenly into most of these? Two is a good choice! If each symbol (🎨) represents 2 students, it will be easy to draw.
- Blue (10 students) will be 10 / 2 = 5 symbols
- Green (8 students) will be 8 / 2 = 4 symbols
- Red (6 students) will be 6 / 2 = 3 symbols
- Yellow (4 students) will be 4 / 2 = 2 symbols
So, your key will be: 🎨 = 2 Students
Step 4: Draw Your Symbols!
Now, draw the correct number of symbols for each category next to its label. Remember to be neat and keep your symbols roughly the same size.
- Blue: 🎨🎨🎨🎨🎨
- Green: 🎨🎨🎨🎨
- Red: 🎨🎨🎨
- Yellow: 🎨🎨
Step 5: Add a Title and Labels!
Give your pictograph a clear title, like 'Favorite Colors of 7th Graders'. Make sure your categories (Blue, Green, Red, Yellow) are clearly labeled. And don't forget to display your key prominently!
Important Tips for Creating Great Pictographs:
- Keep it Simple: Choose a symbol that's easy to draw and recognize.
- Be Consistent: All your symbols should be the same size.
- Clear Key: Make sure your key is super easy to find and understand.
- Partial Symbols: Sometimes you might need to show half a symbol if your data doesn't divide evenly. For example, if your symbol is 2 items and you need to show 1 item, you'd draw half of your symbol.
- Neatness Counts: A messy pictograph is hard to read!
And there you have it! Pictographs are a fantastic way to make numbers come alive and tell a visual story. Keep practicing, and you'll be a pictograph pro in no time!
Keep learning, free
Create a free Syllabax account to unlock practice questions and games for this topic.
Visual Learning Enhanced! 🚀
To help you master this topic, we use Advanced Syllabax AI to generate detailed diagrams and visual models.
Note on Visuals: The AI sometimes makes spelling errors in image labels. Please refer to the lesson text for the correct terminology.