Pie charts (Data Handling)
Watch this topic in 60 seconds
Free preview · Lesson 1
Understanding Pie charts (Data Handling)
Understanding Pie Charts: Slicing Up Data!
Hello, future data detectives! Have you ever looked at a pizza and thought about how each slice represents a part of the whole pizza? Or perhaps how different ingredients make up your favorite smoothie? Well, in the world of math and data, we have a super visual tool that works just like that: it's called a **Pie Chart**!
What is Data Handling? Why Do We Even Care?
Before we dive into pie charts, let's quickly chat about 'Data Handling'. Imagine you're trying to decide what movie to watch with your friends. Everyone has a different favorite genre: some like action, some comedy, some sci-fi. If you just ask everyone and try to remember, it might get messy. But if you *collect* that information (say, by asking each friend to write down their choice), then *organize* it (maybe count how many like each genre), and then *present* it clearly (perhaps in a chart!), that's data handling in a nutshell!
Data handling is all about collecting, organizing, presenting, and interpreting information. It helps us make sense of the world around us, from understanding what snacks are most popular in your class to how a country spends its budget.
Meet the Pie Chart: Your Data Pizza!
A **Pie Chart** (sometimes called a circle graph) is a special kind of chart that looks like a delicious, round pie or pizza! It's used to show how a whole thing is divided into different parts or categories. Think of the entire pie as representing the 'total' or 'whole' amount of something (like 100% of your friends, or all the money spent on groceries).
Analogy Time! The Classroom Cookie Jar
Imagine your teacher brought a giant cookie jar to class, filled with different kinds of cookies: chocolate chip, oatmeal, and peanut butter. If you wanted to show what fraction of all the cookies were chocolate chip, what fraction were oatmeal, and what fraction were peanut butter, a pie chart would be perfect! The entire cookie jar is the 'whole pie', and each type of cookie gets its own 'slice' in the pie chart.
Why Use a Pie Chart? When Are They Super Helpful?
Pie charts are fantastic when you want to show how different categories contribute to a single total. They are excellent for visualizing:
- Parts of a Whole: They clearly show the proportion or percentage of each category relative to the total.
- Comparisons at a Glance: It's easy to see which 'slice' is the biggest (most popular) or smallest (least popular) almost instantly.
For example, if you want to show how students in your class travel to school (walk, bike, car, bus), a pie chart would quickly reveal which method is most common.
The Anatomy of a Pie Chart: What Are Its Parts?
Just like a pizza has a crust, sauce, cheese, and toppings, a pie chart has several important parts:
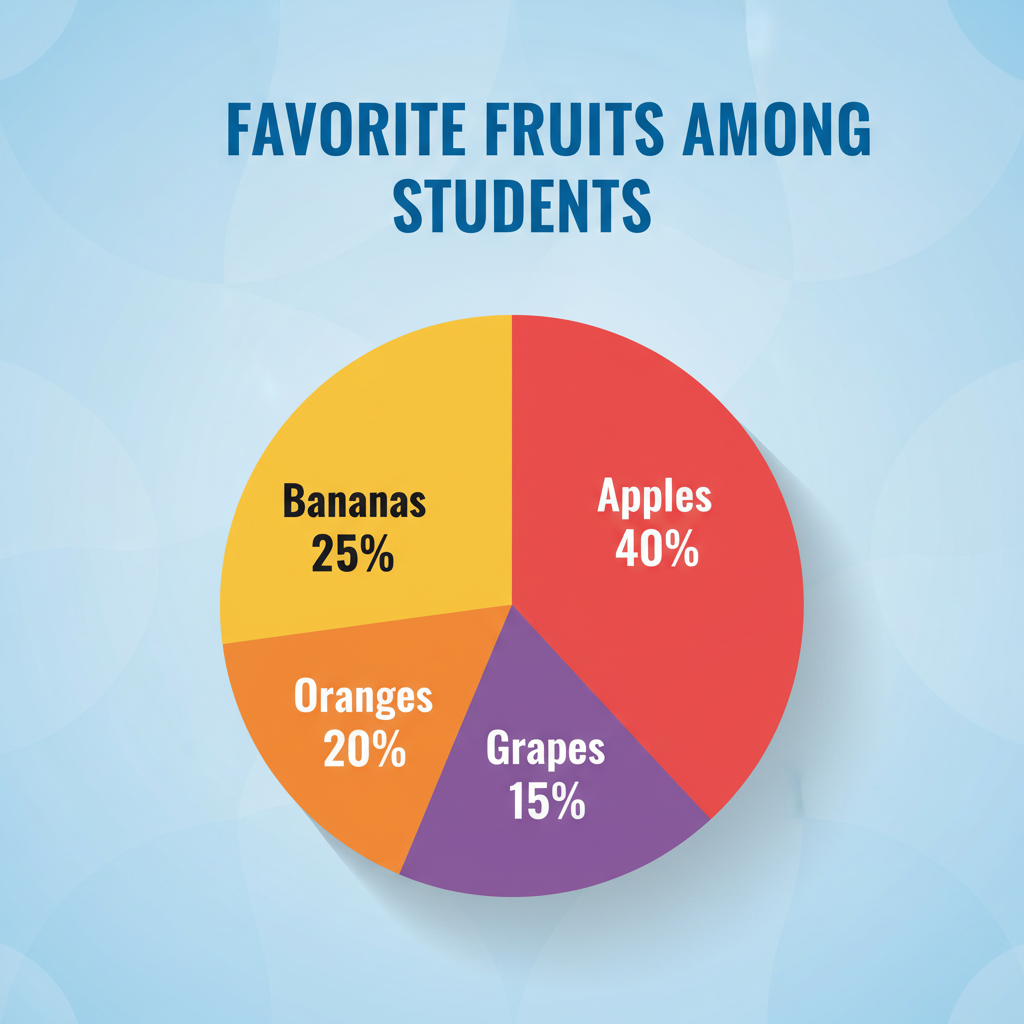
- The Circle (The Whole Pie): This is the entire circular graph. It always represents the total amount of data, which is usually 100% of something. In terms of angles, a full circle is 360 degrees.
- Sectors or Slices (The Pizza Slices): These are the individual wedge-shaped pieces of the pie. Each sector represents a specific category or part of the data. The size of each slice depends on the proportion it represents. A bigger slice means that category makes up a larger part of the total.
- Labels: Each slice usually has a label that tells you what category it represents (e.g., "Chocolate Chip Cookies", "Walking to School").
- Percentages or Values: Often, each slice will also show the percentage or the actual numerical value it represents, making it easy to understand its exact proportion of the whole. For example, a slice might say "40%" or "50 students".
- Legend/Key: If the labels can't fit neatly on the slices, a legend (or key) is used. This is a small box usually next to the pie chart that shows different colors or patterns, and what each one corresponds to (e.g., blue = 'Walking', red = 'Biking').
Here's a visual example of what a pie chart looks like with its various components:
How Do Pie Charts Work? (The Simple Math!)
The magic behind a pie chart is pretty simple: every part contributes to the total. If you add up all the percentages of the slices, they should always equal 100%. If you were thinking about degrees in a circle, all the angles of the slices combined would add up to 360 degrees.
Let's use a simple example: Favorite Colors in Class!
Imagine we asked 20 students in your class about their favorite color, and here's what we found:
- Blue: 10 students
- Red: 5 students
- Green: 3 students
- Yellow: 2 students
Total Students: 10 + 5 + 3 + 2 = 20 students. This total of 20 students represents our 'whole pie' (100%).
Now, let's figure out the 'size' of each slice. We can do this with percentages:
- Blue: (10 out of 20) = 10/20 = 0.50 = 50%
- Red: (5 out of 20) = 5/20 = 0.25 = 25%
- Green: (3 out of 20) = 3/20 = 0.15 = 15%
- Yellow: (2 out of 20) = 2/20 = 0.10 = 10%
If you add up these percentages (50% + 25% + 15% + 10%), you get 100%. Perfect! On a pie chart, the 'Blue' slice would be half of the circle, 'Red' would be a quarter, and so on.
Reading and Interpreting Pie Charts: Becoming a Data Detective!
Reading a pie chart is like reading a story about data. Here's how you do it:
- Look at the Title: What is the chart about? (e.g., "Favorite Sports of 8th Graders")
- Check the Legend/Labels: What do the different colors or sections represent?
- Identify the Biggest Slice: This tells you which category has the largest share or is the most popular.
- Identify the Smallest Slice: This shows the category with the smallest share.
- Compare Slices: You can easily see which categories are larger or smaller than others. For example, is 'Football' twice as popular as 'Basketball'?
- Look at Percentages/Values: These give you the precise numbers for each category.
Analogy: Your Family Budget Pie
Imagine your family's monthly budget is represented by a pie chart. You might see a large slice for 'Housing', a smaller slice for 'Food', an even smaller slice for 'Entertainment', and a tiny slice for 'Savings'. By looking at this chart, you can immediately tell where most of the money goes and where the least is spent. This helps in making financial decisions!
Advantages of Using Pie Charts
- Easy to Understand: They provide a quick and clear visual summary of data.
- Show Proportions Clearly: Great for illustrating how parts contribute to a whole.
- Visually Appealing: They can make data more engaging and easier to remember.
Limitations of Pie Charts
While great, pie charts aren't perfect for everything:
- Too Many Slices = Messy: If you have too many categories (say, more than 5-7), the slices become very thin and hard to label or distinguish. It's like having too many toppings on a pizza – it gets crowded!
- Hard to Compare Similar Slices: It can be difficult to accurately compare two slices that are very similar in size, especially without percentages labeled. Is 24% really bigger than 23% just by looking? Not always easy!
- Not for Trends Over Time: Pie charts show a snapshot at one moment. They don't show how data changes over days, months, or years. For that, you'd use a different type of chart, like a line graph.
Conclusion
Pie charts are a fundamental tool in data handling, offering a simple yet powerful way to visualize how different parts make up a whole. By understanding their components, how they're constructed, and how to read them, you're well on your way to becoming a data-savvy individual! Keep practicing, and soon you'll be slicing up data like a pro!
Keep learning, free
Create a free Syllabax account to unlock practice questions and games for this topic.
Visual Learning Enhanced! 🚀
To help you master this topic, we use Advanced Syllabax AI to generate detailed diagrams and visual models.
Note on Visuals: The AI sometimes makes spelling errors in image labels. Please refer to the lesson text for the correct terminology.