Bias in Data Collection
Watch this topic in 60 seconds
Free preview · Lesson 1
Understanding Bias in Data Collection
Understanding Bias in Data Collection: A Foundation for Fair Information (Grade 9)
Have you ever heard the phrase, "Don't judge a book by its cover"? It's about not forming an opinion based on incomplete or misleading information. In the world of data, we have a similar, but much bigger, challenge: bias. Just like a tilted scale can give you the wrong weight, bias in data collection can give you a completely wrong picture of reality.
What is Data, Anyway?
Before we dive into bias, let's quickly remember what data is. Data is simply information, facts, or statistics collected for analysis or reference. It's like the ingredients you gather before baking a cake – you need the right ones, in the right amounts, to get a good result. If you accidentally use salt instead of sugar, your cake won't turn out well, right? That's what happens when your data has bias – it messes up the whole recipe!
The Sneaky Problem: What is Bias?
Imagine you're trying to figure out the average height of all students in your school. If you only measure the basketball team, what kind of average height would you get? Probably a much taller one than the actual average for the whole school! This is bias in action.
Bias, in simple terms, means a tendency or inclination, especially one that prevents unprejudiced consideration of a question. When we talk about data, bias means that your data collection method or your data itself is systematically skewed or favors a certain outcome or group over others. It's like wearing sunglasses that make everything look a little bit green – you're not seeing the true colors of the world.
Where Does Bias Hide in Data Collection?
Bias isn't always obvious. It's not usually someone intentionally trying to trick you. Often, it creeps in accidentally because of how we choose to collect our information. Let's look at two major hiding spots for bias:
1. Sampling Bias: Who Did You Ask?
Imagine you want to know what the most popular flavor of ice cream is in your town. If you only ask people leaving a specific store that *only* sells vanilla ice cream, what answer are you most likely to get? "Vanilla!" Of course! But this doesn't tell you what the whole town likes, does it?
Sampling bias occurs when the way you select your group of people (your 'sample') for a survey or study doesn't accurately represent the larger group (the 'population') you're trying to learn about. It's like trying to understand what *all* animals eat by only observing a group of rabbits – you'd conclude that everyone eats carrots, which isn't true!
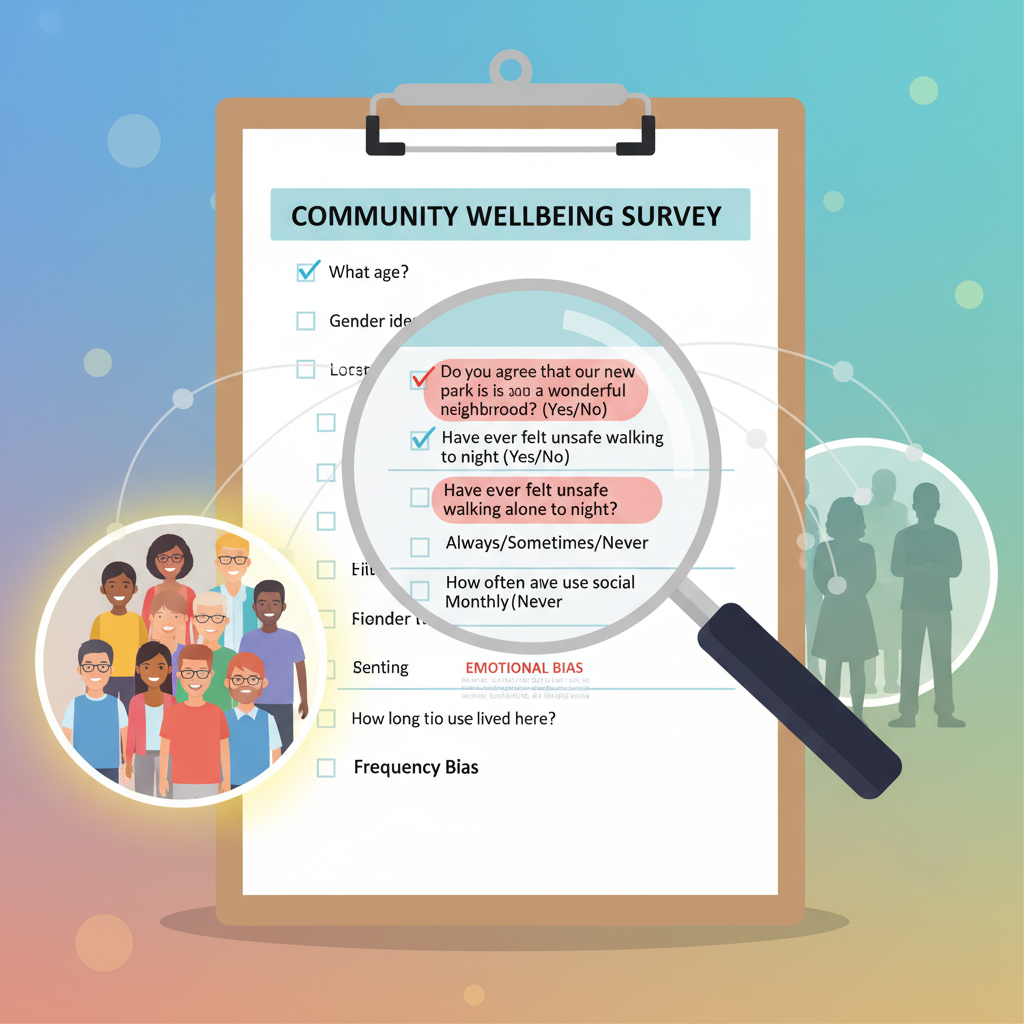 ⚠️ This picture may have spelling mistakes. Trust the words in the lesson.
Types of Sampling Bias:
- Convenience Sampling: This is when you pick people who are easiest to reach. If you want to know what students think about the new school lunch menu, and you only ask your friends sitting at your lunch table, that's convenience sampling. Your friends' opinions might not reflect the opinions of all 500 students in the cafeteria. It's like trying to get a full picture of a forest by only looking at the trees right outside your window.
- Self-Selection Bias (or Voluntary Response Bias): Imagine a website that asks, "Do you love our amazing new game? Click 'Yes' or 'No'!" Who do you think is most likely to click? People who *really* love the game, or people who *really* hate it! Most people in the middle, who feel neutral, probably won't bother. This means the results will be skewed towards the extremes. It's like trying to find out if a concert was good by only asking the people who stayed until the very end (who probably loved it) or who left very early (who probably hated it).
- Undercoverage: This happens when certain groups from your population are completely left out or are underrepresented in your sample. For example, if you're surveying about internet usage and only call landline phones, you'll miss out on a lot of younger people who only use cell phones, or people who rely on mobile data plans. You're effectively leaving out a whole chapter of the story.
2. Measurement Bias: How Did You Ask?
Even if you've got a perfectly representative group of people, the way you ask questions or measure things can still introduce bias. Think of it like trying to measure your height with a ruler that always adds an extra inch. No matter who measures, the result will always be slightly off!
Measurement bias occurs when the method of data collection itself is flawed, leading to inaccurate or distorted results. This isn't about *who* you ask, but *how* you ask or *how* you measure.
Types of Measurement Bias:
- Leading Questions: These are questions that subtly push people towards a certain answer. Instead of asking, "How satisfied are you with our customer service?" a leading question might be, "Don't you agree that our customer service is excellent?" The second question makes it harder for someone to say no, even if they weren't satisfied. It's like asking, "You're not going to eat that unhealthy burger, are you?" instead of "What would you like for lunch?"
- Response Bias (Social Desirability Bias): This happens when people answer questions in a way they think will make them look good or be socially acceptable, even if it's not entirely true. For example, if you ask students, "Do you always complete your homework on time?" many might say "Yes," even if they sometimes forget, because they want to appear responsible. It's like telling your dentist you floss every day, even if you sometimes skip a day (or five!).
- Observer Bias: Sometimes, the person collecting the data can unintentionally influence the results because of their own expectations or beliefs. If a researcher believes a new teaching method is superior, they might unconsciously pay more attention to positive student reactions or interpret neutral student responses as positive, even if they try to be objective. It's like a sports fan watching their favorite team and seeing every questionable call go against them, even if it was fair.
Why Does Bias Matter? The Ripple Effect
So, why is all this important? Biased data leads to biased conclusions. If you make decisions based on biased data, those decisions will likely be unfair, ineffective, or even harmful. Think about it:
- If a school only surveys students who are doing well to improve its academic programs, it might miss the needs of struggling students.
- If a city council tries to figure out public transport needs but only surveys wealthy neighborhoods, they might neglect areas where people rely heavily on buses or trains.
- If a company develops a new product based on feedback from only one demographic, that product might not appeal to or work for everyone.
Making decisions based on biased data is like trying to build a strong bridge using faulty measurements – eventually, it's going to cause problems.
Spotting and Avoiding Bias (The First Steps)
Being completely free of bias is incredibly difficult, but the first step is always awareness! Here’s what you can start thinking about:
- Question the source: Who collected this data? How did they collect it?
- Think about the sample: Who was included? Who might have been left out? Does the group seem representative of the larger population?
- Look at the questions: Do the questions seem fair and neutral, or do they push you towards a certain answer?
- Consider the context: Are people likely to answer truthfully, or might they feel pressure to answer a certain way?
Understanding bias isn't about becoming a data detective overnight, but it is about learning to look critically at the information presented to you. It helps you become a more informed student, consumer, and citizen in a world full of data!
Keep learning, free
Create a free Syllabax account to unlock practice questions and games for this topic.
Visual Learning Enhanced! 🚀
To help you master this topic, we use Advanced Syllabax AI to generate detailed diagrams and visual models.
Note on Visuals: The AI sometimes makes spelling errors in image labels. Please refer to the lesson text for the correct terminology.