Answering Graph Questions
Watch this topic in 60 seconds
Free preview · Lesson 1
Understanding Answering Graph Questions
Welcome to Graph Detective Fun for Grade 1!
Hello, super learners! Today, we're going to become amazing detectives, but instead of looking for clues in a mystery, we're going to look for clues in special pictures called graphs! A graph is just a fancy word for a picture that shows us information. It helps us see numbers and facts very clearly and easily. Think of it like a special map for numbers!
What is a Graph? (It's a Picture Story!)
Imagine your teacher asks everyone in class, 'What's your favorite animal?' Some kids might say 'dog,' some 'cat,' and others 'fish.' If you just hear a lot of answers, it's hard to remember who liked what, right?
A graph helps us put all that information into a neat picture. It's like drawing a picture story about what everyone likes! Instead of just words, we use pictures or bars to show 'how many' of something there is.
Meet the Picture Graph (Pictograph)
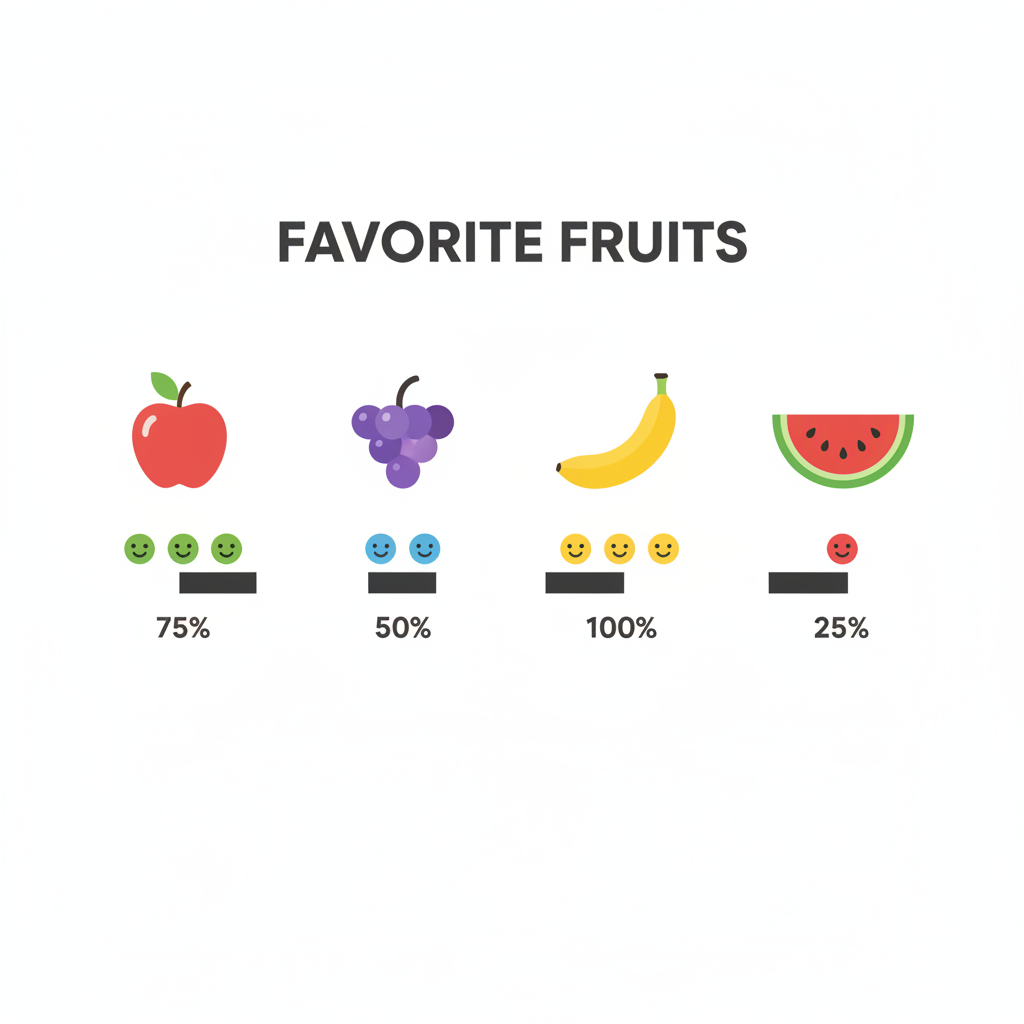
One super fun type of graph is called a Picture Graph, or sometimes a Pictograph. It uses little pictures to show how many of each thing there is. Imagine you're counting apples. Instead of writing '5 apples,' you draw 5 little apple pictures!
Let's say we asked kids their favorite fruit, and here's what we found:
- 3 kids like Apples 🍎🍎🍎
- 5 kids like Bananas 🍌🍌🍌🍌🍌
- 2 kids like Oranges 🍊🍊
A picture graph would show this information using those fruit pictures! Each picture stands for one child. It's like having a little sticker chart where each sticker tells you a number.
Meet the Bar Graph (Tall Towers!)
Another cool graph is a Bar Graph. Instead of little pictures, it uses colorful bars (like tall towers!) to show how many. The taller the tower, the more of that thing there is!
Using our favorite animal example:
- Dogs: 4 kids
- Cats: 3 kids
- Fish: 2 kids
A bar graph would have a tall bar for 'Dogs' that goes up to the number 4, a slightly shorter bar for 'Cats' that goes up to 3, and a short bar for 'Fish' that goes up to 2. It's like building towers of blocks, and the height of the tower tells you how many blocks are in it!
How to Be a Graph Detective: Answering Questions!
Now that you know what graphs are, let's learn how to read them and answer questions, just like a super detective finding clues!
Clue 1: Look at the Title! (What's the Story About?)
Every good graph has a title. The title is like the name of the story. It tells you what the graph is all about. For example, 'Our Favorite Fruits' or 'Number of Pets in Our Class.' Always read the title first!
Clue 2: Look at the Labels! (What are We Counting?)
Next, look at the labels. These are the words that tell you what each picture or bar stands for. In our fruit graph, the labels would be 'Apples,' 'Bananas,' and 'Oranges.' In our pet graph, they would be 'Dogs,' 'Cats,' and 'Fish.' These labels help you know what you are looking at.
Clue 3: Count the Pictures or Look at the Bar Height! (How Many?)
This is where the real counting happens!:
- For Picture Graphs: Count the little pictures for each item. If there are 3 apple pictures, it means 3 kids like apples. Simple!
- For Bar Graphs: Look at how tall each bar is. Follow the top of the bar across to the numbers on the side (or bottom) to see what number it reaches. If the 'Dog' bar goes up to the number 4, it means 4 kids like dogs.
Clue 4: Look at the Key! (Important for Pictographs!)
Sometimes, in a pictograph, one picture might mean MORE than one thing. This is called a key. For example, a key might say: '🍎 = 2 apples.' This means every apple picture you see actually stands for 2 apples! But for Grade 1, usually one picture means one thing. It's good to know for later though!
Answering Common Graph Questions:
Once you've found all your clues (title, labels, counts), you can answer questions like a pro!
- 'How many...?' Just count the pictures or check the height of the bar for that specific item.
- 'Which has the most...?' Look for the item with the most pictures or the tallest bar. That's the winner!
- 'Which has the least...?' Look for the item with the fewest pictures or the shortest bar. That's the smallest group.
- 'How many more/less...?' This means you need to compare two items. Find how many of the first item, find how many of the second item, and then count the difference! (e.g., if 5 like bananas and 3 like apples, 5 - 3 = 2, so 2 more kids like bananas.)
- 'How many in total?' This means you need to add up all the numbers from all the items on the graph.
Reading graphs is like solving a fun puzzle! The more you practice, the better you'll become at understanding all the amazing information hidden in these picture stories. Keep being curious and exploring graphs around you!
Keep learning, free
Create a free Syllabax account to unlock practice questions and games for this topic.
Visual Learning Enhanced! 🚀
To help you master this topic, we use Advanced Syllabax AI to generate detailed diagrams and visual models.
Note on Visuals: The AI sometimes makes spelling errors in image labels. Please refer to the lesson text for the correct terminology.