Using Tally Charts
Watch this topic in 60 seconds
Free preview · Lesson 1
Understanding Using Tally Charts
Welcome to the World of Tally Charts!
Hello, young mathematicians! Have you ever tried to count a lot of things all at once? Maybe how many friends chose pizza for lunch, or how many red cars you see on the way to school? Sometimes, counting many things can get a little tricky. You might lose track or forget where you started!
What is "Data" Anyway?
Imagine you're a detective, and you're trying to find out information about something. This information is called data. Data is just a fancy word for facts or numbers that we collect. For example, knowing how many people like apples is data. Knowing how many sunny days we had last month is also data!
Why do we collect data? Because it helps us understand the world around us better! It helps us make decisions, like deciding what flavor of ice cream to stock the most, or what game most friends want to play.
Meet the Tally Chart: Your Counting Helper!
One super simple and super fun way to collect and organize data is by using something called a Tally Chart. Think of a tally chart as a special notebook where you keep track of your counts using unique marks instead of just numbers.
What are Tally Marks?
Tally marks are like quick, easy strokes you make for each item you count. It's like giving each thing a little checkmark. But there's a special rule that makes counting much faster!
Here's how it works:
- For the first item you count, you draw a single straight line, like this: |
- For the second item, another line: ||
- For the third item, another line: |||
- For the fourth item, another line: ||||
- Now for the special rule! For the fifth item, you don't draw another straight line. Instead, you draw a diagonal line right across the first four lines. It looks like you're tying them all up in a neat little bundle! This bundle looks like this:
||||
Why do we do this? Imagine you have a stack of coins. It's easier to count them if they're grouped into piles of five or ten, right? Tally marks do the same thing! By bundling every five marks, it becomes much, much easier to count large numbers quickly. Instead of counting individual lines, you just count the bundles of five and then add any extra lines.
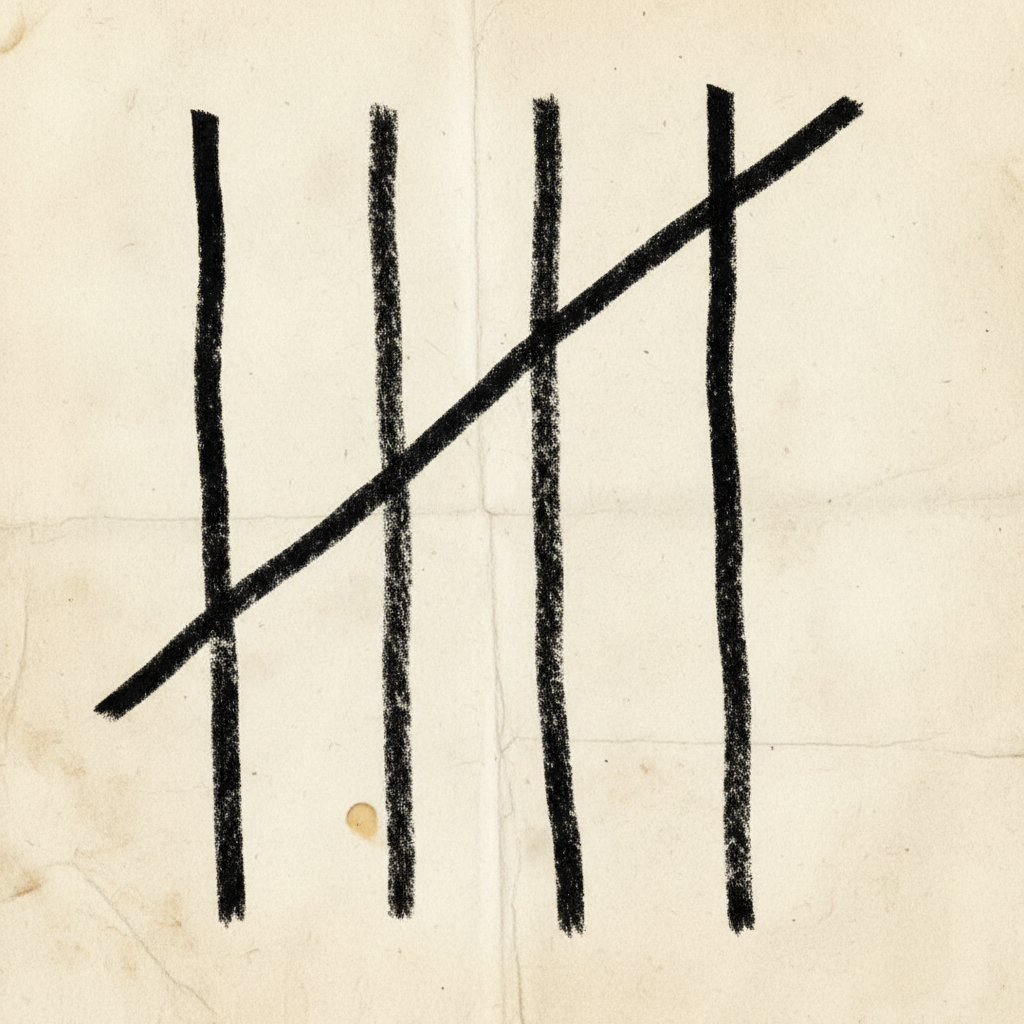
Let's try an analogy: Imagine you're collecting stickers. If you just have a huge pile of individual stickers, it's hard to know how many you have. But if you put them into little bags, and each bag holds exactly five stickers, it's super easy to count! You just count the bags, and then any extra stickers. Tally marks are like those little bags of five!
How to Use a Tally Chart: A Step-by-Step Adventure!
Let's say you want to find out what everyone's favorite color is in your class. Here's how you'd use a tally chart:
Step 1: Make a Plan!
First, you need to decide what you're counting. In our example, it's "Favorite Colors." You'll also need to list all the possible choices. Let's say the choices are Red, Blue, Green, Yellow, and Purple.
Step 2: Create Your Tally Chart Table
Draw a table with two main columns. One column will be for the "Category" (like the colors), and the other will be for "Tally Marks." You might also want a third column for "Total" number.
It might look something like this:
------------------------------------
| Favorite Color  | Tally Marks | Total |
------------------------------------
| Red             |             |       |
| Blue            |             |       |
| Green           |             |       |
| Yellow          |             |       |
| Purple          |             |       |
------------------------------------
Step 3: Start Collecting Data and Making Tally Marks!
Now, go around and ask each person their favorite color. Every time someone tells you their favorite color, you make one tally mark in the "Tally Marks" column next to that color.
- If Alex says "Red," you make: | next to Red.
- If Mia says "Blue," you make: | next to Blue.
- If Sam says "Red" again, you make: || next to Red.
- If Lily says "Green," you make: | next to Green.
- If Ben says "Red" again, you make: ||| next to Red.
- If Chloe says "Blue" again, you make: || next to Blue.
- If David says "Red" again, you make: |||| next to Red.
- Aha! If Emily says "Red" again, this is the FIFTH Red! So you draw a diagonal line across the first four. Now "Red" looks like:
||||
Step 4: Count Your Tallies and Find the Total!
Once you've asked everyone, you'll have a bunch of tally marks. Now, it's time to count them up! Remember, each bundle of five is easy to spot. Count how many bundles of five you have, and then add any extra single lines.
Let's say your chart ended up like this:
------------------------------------ | Favorite Color | Tally Marks | Total | ------------------------------------ | Red |||||||| | 8 | (One bundle of 5, plus 3 more = 8) | Blue |||||| 5 | (One bundle of 5 = 5) | Green | ||| | 3 | (Three single marks = 3) | Yellow | || | 2 | (Two single marks = 2) | Purple |||||| | 6 | (One bundle of 5, plus 1 more = 6) ------------------------------------
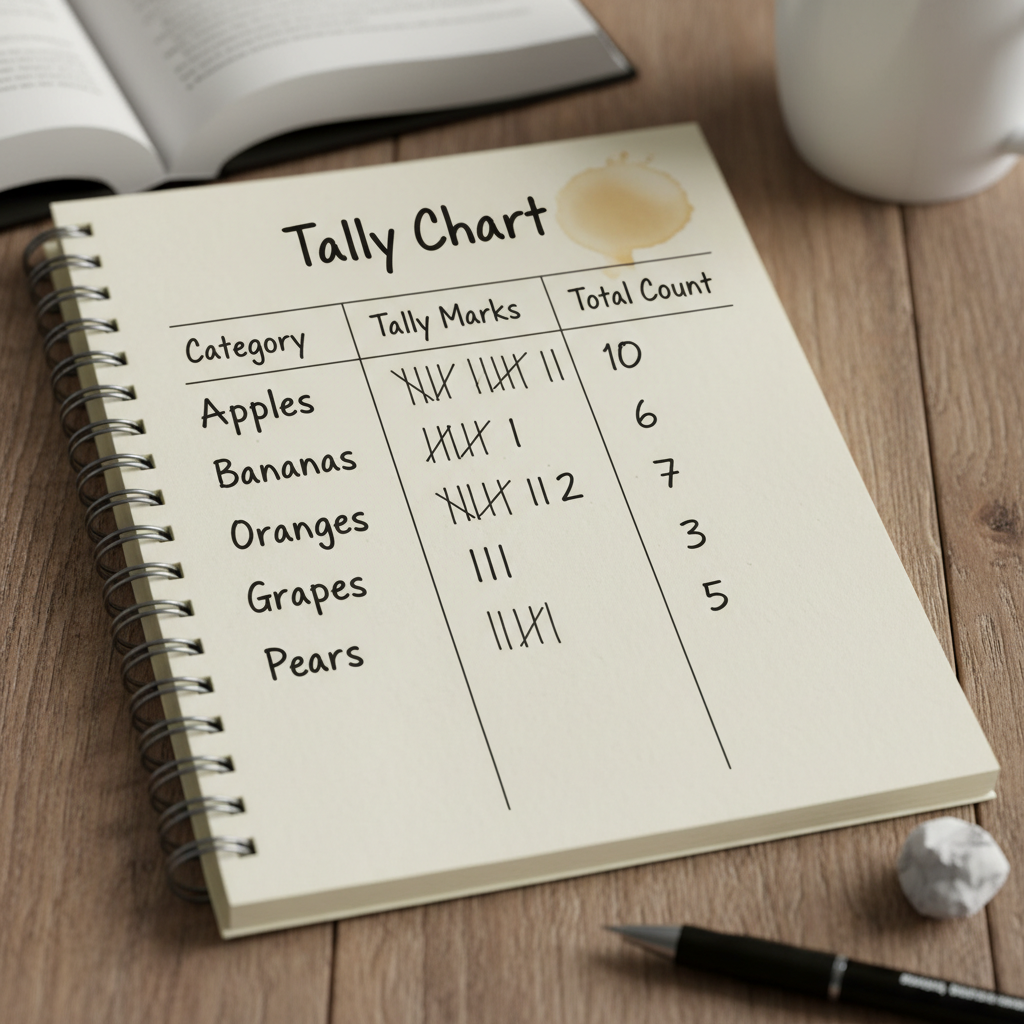 ⚠️ This picture may have spelling mistakes. Trust the words in the lesson.
From this completed tally chart, you can easily see that Red is the most popular color (8 votes) and Yellow is the least popular (2 votes)! How easy was that?
Why Are Tally Charts So Great?
- Easy to Use: You don't need fancy tools, just a pencil and paper!
- Quick Counting: Grouping by five makes counting large numbers super fast. You just count the bundles.
- Clear Picture: It gives you a clear visual idea of which categories have more or less.
- Real-World Useful: People use tally charts for all sorts of things! From counting votes in an election to keeping score in a game, or even counting how many birds visit a bird feeder.
Let's Practice a Little More!
Imagine you are keeping track of how many goals were scored in a soccer game. Every time a goal is scored, you make a tally mark.
- Goal 1: |
- Goal 2: ||
- Goal 3: |||
- Goal 4: ||||
- Goal 5:
||||(That's one bundle of 5!) - Goal 6:
||||| - Goal 7:
||||||
After 7 goals, you would have one bundle of five and two single marks. You can instantly see it's 5 + 2 = 7 goals! Isn't that neat?
Time to Review!
Remember, a tally chart is your friendly helper for counting and organizing information. It uses special marks, grouped into fives, to make counting simple and quick. It's a foundational skill that helps you understand data better, and it's used by many people every day!
So, next time you need to count a lot of things, grab a paper and a pencil and make a tally chart!
Keep learning, free
Create a free Syllabax account to unlock practice questions and games for this topic.
Visual Learning Enhanced! 🚀
To help you master this topic, we use Advanced Syllabax AI to generate detailed diagrams and visual models.
Note on Visuals: The AI sometimes makes spelling errors in image labels. Please refer to the lesson text for the correct terminology.