Counting Data Points
Watch this topic in 60 seconds
Free preview · Lesson 1
Understanding Counting Data Points
Counting Data Points: Finding Out "How Many?"
Hello, young mathematicians! Today, we're going on an exciting adventure into the world of "data" and learning how to "count data points." Don't let those big words scare you! It's actually something you already do almost every day without even realizing it. It's as simple as counting your toys or your friends!
What is "Data" Anyway?
Imagine your brain is like a giant collection box. Every time you learn something new, see something, or hear something, you add a little piece of information to that box. This information is called data. It's just a fancy word for facts, numbers, words, or observations that we collect.
- What's your favorite animal? (That's data!)
- How many blue cars did you see on the way to school? (That's data!)
- What kind of snack do you like best? (That's data too!)
Data helps us understand the world around us. It's like collecting clues to solve a mystery!
And What's a "Data Point"?
If "data" is all the information, then a data point is just one single, tiny piece of that information. Think of it like this:
- If you have a big box of LEGO bricks, the whole box of bricks is your "data."
- Each individual LEGO brick is a "data point."
So, when we talk about "counting data points," we're just talking about counting each individual piece of information or each individual thing that we are interested in. It's like counting how many LEGO bricks you have!
Why Do We Count Data Points? It Helps Us Understand!
Counting data points is super important because it helps us answer questions and make sense of things. Imagine you want to know:
- How many students in your class like apples more than bananas?
- How many sunny days were there last month?
- How many different types of birds visit your bird feeder?
To answer these questions, you need to count! Counting data points gives us a clear picture. It tells us "how many" of something there is.
Analogy Time: The Candy Store!
Imagine you go to a candy store, and you want to buy some jelly beans. The store has a giant jar filled with red, green, and yellow jelly beans. You want to know if there are more red ones or more green ones. Each jelly bean is a data point. To find out which color has more, you would have to count each red jelly bean, then each green jelly bean, and then each yellow jelly bean. By counting these data points, you get the answer!
Simple Ways to Count Data Points
There are a few easy ways we can count data points:
1. The "Point and Count" Way
This is the simplest way! You just point to each item you want to count and say the numbers out loud: "one, two, three, four..." Make sure you only count each item once!
2. Using Tally Marks
Tally marks are a super helpful way to keep track when you're counting a lot of data points. Here's how they work:
- For each data point you count, you draw a straight line ( | ).
- When you get to the fifth data point, you draw a line diagonally across the first four ( ⇳ ). This makes a group of five!
It's like bundling sticks together! Each bundle has five sticks, which makes it much easier to count larger numbers quickly. For example, if you see two groups of five and two extra lines, you know right away it's 5 + 5 + 2 = 12!
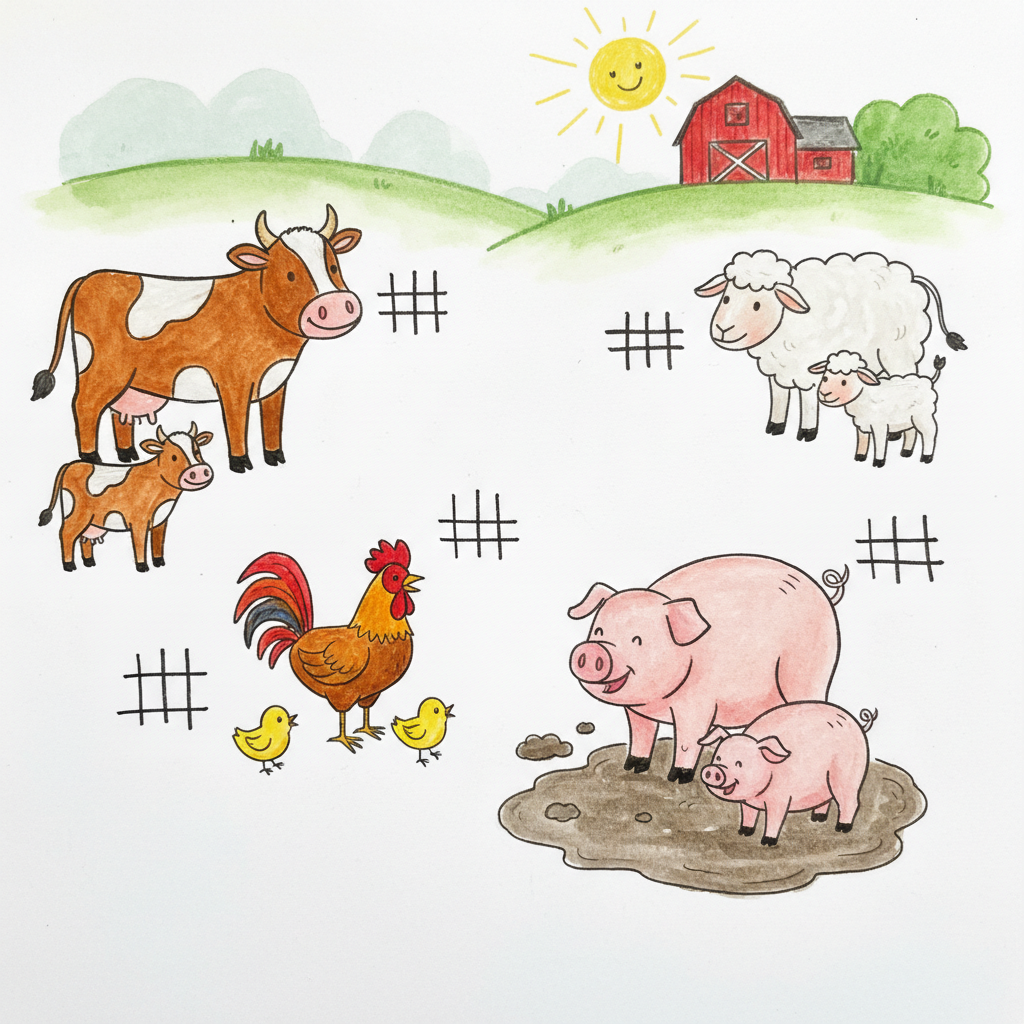
Let's Try an Example: Counting Animals on a Farm!
Imagine you're visiting a farm, and you see different animals. You want to count how many of each animal there are. Here's what you see:
- Cow
- Chicken
- Pig
- Chicken
- Cow
- Sheep
- Pig
- Chicken
- Cow
- Sheep
Let's use tally marks to count our animal data points:
- Cow: | | | (3 cows)
- Chicken: | | | (3 chickens)
- Pig: | | (2 pigs)
- Sheep: | | (2 sheep)
See? By counting each animal as a data point, we quickly learn how many of each kind there are!
 ⚠️ This picture may have spelling mistakes. Trust the words in the lesson.
Another Example: Counting Favorite Colors!
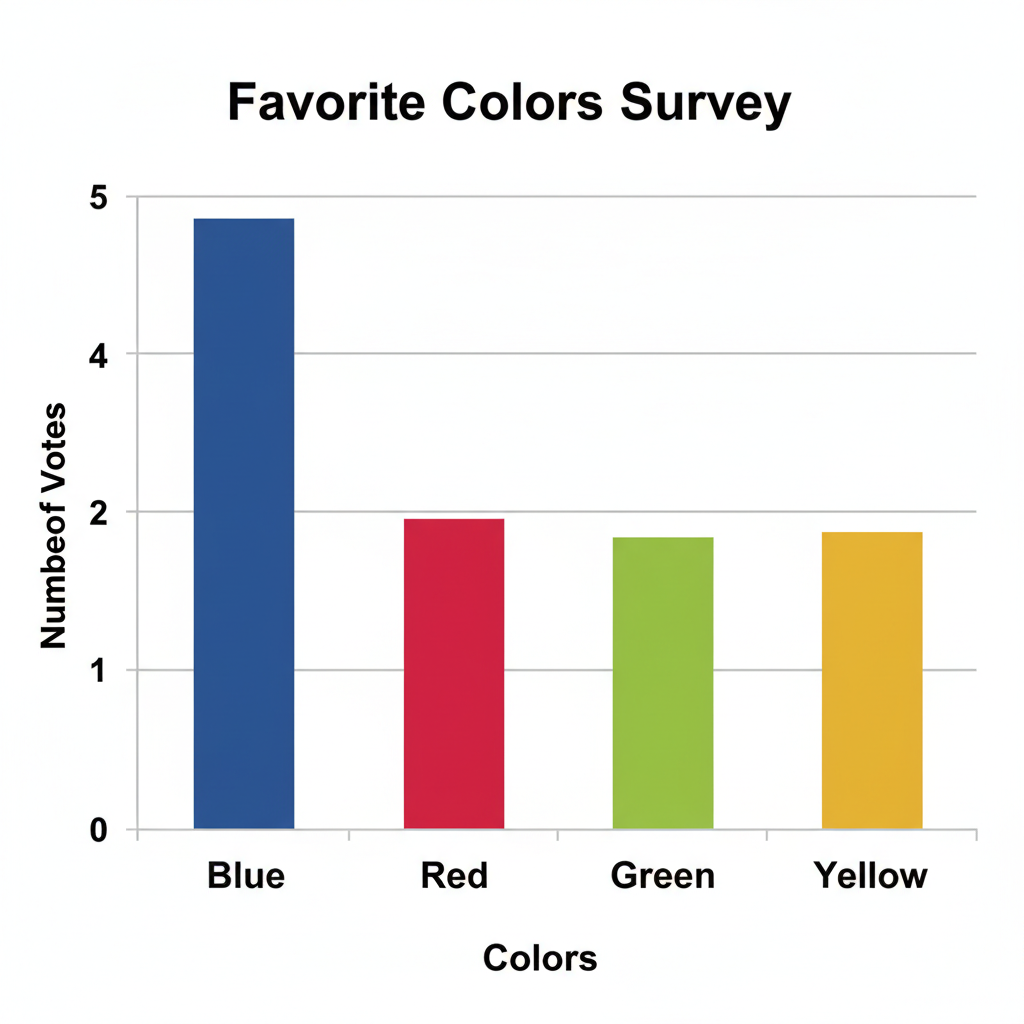
Let's say you ask 10 of your friends what their favorite color is. Here are their answers:
- Sarah: Blue
- Tom: Red
- Lily: Green
- Max: Blue
- Chloe: Red
- Jake: Yellow
- Emma: Blue
- Noah: Green
- Ava: Red
- Liam: Blue
Each friend's favorite color is a data point. Let's count them:
- Blue: | | | | (4 friends chose blue)
- Red: | | | (3 friends chose red)
- Green: | | (2 friends chose green)
- Yellow: | (1 friend chose yellow)
Now we know that blue is the most favorite color among these friends!
The Superpower of Counting Data Points!
Counting data points might seem simple, but it's a super powerful skill! It helps you:
- Understand groups: You can see which group has more or less.
- Answer questions: You can quickly find out "how many."
- Make decisions: If you know most of your friends like pizza, you might suggest pizza for a party!
This skill is used everywhere – by scientists, teachers, shopkeepers, and even you when you're deciding which game to play based on how many friends want to play it!
 ⚠️ This picture may have spelling mistakes. Trust the words in the lesson.
Keep Practicing!
Counting data points is a fundamental skill that you will use throughout your life. Whether you're counting how many points your team scored in a game, or how many different kinds of flowers are in a garden, you're using this important math skill. Keep practicing, and you'll become a data-counting superstar!
Keep learning, free
Create a free Syllabax account to unlock practice questions and games for this topic.
Visual Learning Enhanced! 🚀
To help you master this topic, we use Advanced Syllabax AI to generate detailed diagrams and visual models.
Note on Visuals: The AI sometimes makes spelling errors in image labels. Please refer to the lesson text for the correct terminology.