Venn diagrams (Logical Reasoning)
Watch this topic in 60 seconds
Free preview · Lesson 1
Understanding Venn diagrams (Logical Reasoning)
Unraveling Relationships: An Introduction to Venn Diagrams (Grade 9 Foundational)
Welcome, future logical thinkers! Have you ever tried to organize your thoughts, or understand how different groups of things relate to each other? Sometimes, words alone can make things a bit messy. This is where a fantastic tool called a Venn Diagram comes to the rescue! It's like a visual superhero for sorting information.
What is Logical Reasoning? Why Do We Need It?
Before we dive into diagrams, let's talk about Logical Reasoning. Imagine you're trying to figure out if you have enough money for a new video game and a snack. You logically reason: "Game costs
It's about thinking clearly, making sense of information, and drawing sound conclusions. In real life, it helps you solve problems, make good decisions, and even understand arguments better. Venn diagrams are one of our first stops on the journey to becoming expert logical reasoners.
Introducing the Venn Diagram: Your Visual Organizer!
So, what exactly is a Venn Diagram? Picture this: You're hosting a party, and you want to know which guests like pizza, which like ice cream, and which like both. Instead of making long lists and getting confused, you could draw some circles!
A Venn Diagram is a visual tool that uses overlapping circles to show the relationships between different groups of things, called 'sets.' It helps us see what items are common to multiple groups, what items are unique to one group, and what items don't belong to any of the groups we're focusing on.
A Brief Nod to History
The concept of using diagrams to illustrate logical relationships dates back centuries, but the specific, widely recognized type of diagram we use today was popularized in the late 19th century by an English logician named John Venn. Pretty neat that it's named after him, right?
The Building Blocks: Parts of a Venn Diagram
Every Venn diagram has a few key ingredients:
-
The Universal Set (The Big Picture)
Imagine you're talking about all the students in your school. That's your big, overarching group. In a Venn Diagram, this 'big picture' is called the Universal Set. It's usually represented by a large rectangle that contains all the circles.
- Analogy: Think of the Universal Set as your backyard fence. Everything inside that fence is what you're currently interested in – your entire garden, your dog, your swing set. Nothing outside the fence matters for *this specific discussion*.
-
Sets (The Circles)
Inside your universal set (the rectangle), you'll find circles. Each circle represents a specific set, which is just a collection of distinct items. For example, one circle might be "Students who like Soccer" and another might be "Students who like Basketball."
- Analogy: If the universal set is your backyard, then the circles are like different designated areas within it – a flower bed, a vegetable patch, or a play area for your pet. Each area has its own specific items.
-
Elements (The Specific Items)
Each individual item within a set is called an element. If your set is "Students who like Soccer," then 'Maria,' 'David,' and 'Sarah' would be elements if they like soccer.
- Analogy: If a set is your flower bed, then a rose, a tulip, or a daisy are its individual elements.
Decoding Relationships: What Do the Overlaps Mean?
The magic of Venn diagrams truly shines when circles overlap (or don't!). Let's explore the key relationships:
1. Intersection (The 'AND' or 'Common Ground') 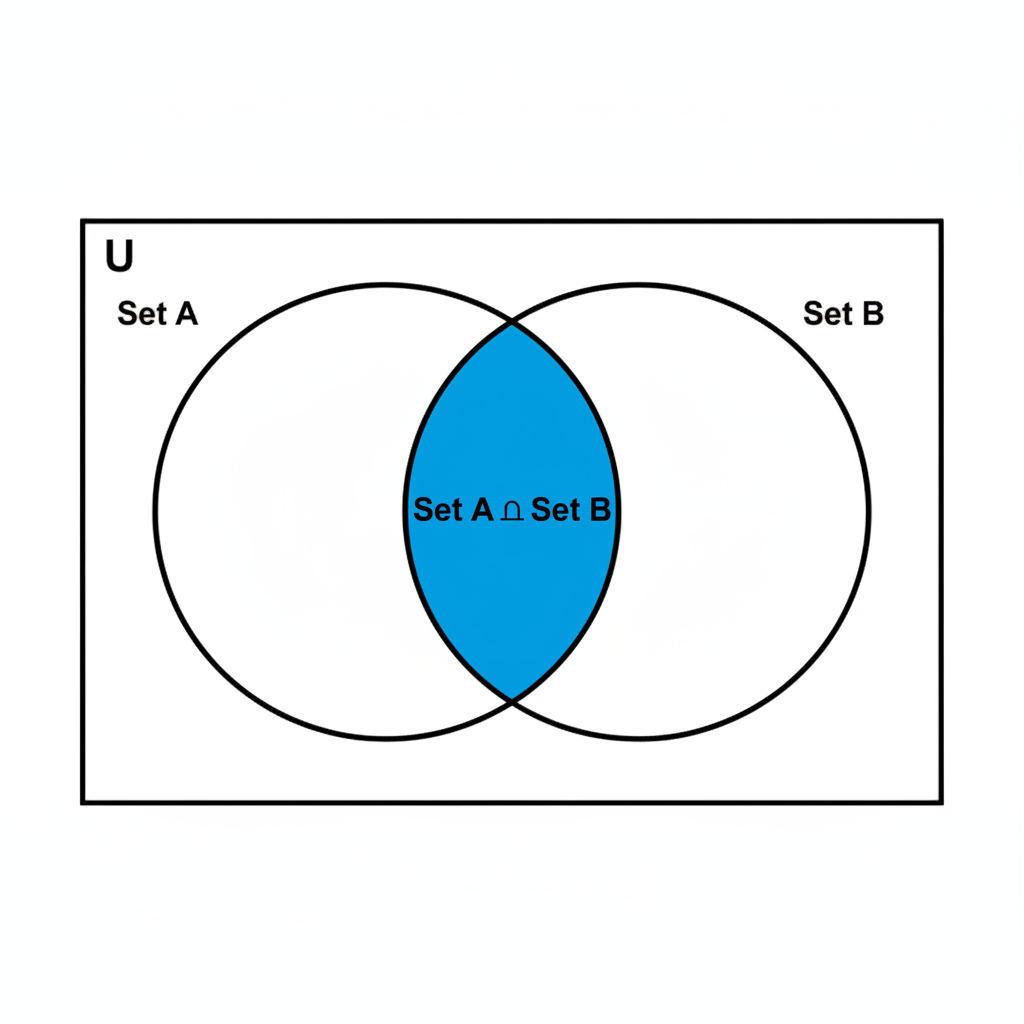
-
When two circles overlap, the area where they meet is called the Intersection. This region represents the elements that belong to BOTH sets. It's like finding common ground.
- Analogy: Imagine two friends, Alex and Ben, both have toy boxes. The intersection is like the toys they both share and play with together. If one circle is 'People who like Chocolate' and another is 'People who like Vanilla', the intersection would be 'People who like BOTH Chocolate AND Vanilla'.
- Symbol: We use the symbol '∩' to denote intersection. So, A ∩ B means "elements common to Set A AND Set B."
2. Union (The 'OR' or 'Everything Combined')
-
The Union of two or more sets includes all the elements that are in ANY of the sets. Think of it as combining everything without listing duplicates.
- Analogy: Going back to Alex and Ben's toy boxes, the union would be *all* the toys from Alex's box *and* *all* the toys from Ben's box, but if they have a shared toy, you only count it once. If one circle is 'People who like Dogs' and another is 'People who like Cats', the union would be 'People who like Dogs OR Cats (or both!)'.
- Symbol: We use the symbol '∪' to denote union. So, A ∪ B means "elements in Set A OR Set B (or both)."
3. Complement (The 'NOT' or 'Everything Else in the Universe')
-
The Complement of a set includes all the elements that are NOT in that particular set, but are still within the Universal Set.
- Analogy: If your universal set is 'All students in your class' and one set is 'Students who play soccer', the complement of that set would be 'Students in your class who do NOT play soccer'. It's everyone *outside* the circle but *inside* the big rectangle.
- Symbol: We often use a prime symbol (') or a 'c' as a superscript to denote complement. So, A' or Ac means "elements NOT in Set A."
4. Disjoint Sets (No Common Ground)
-
Sometimes, two circles don't overlap at all! This means they have absolutely no elements in common. These are called Disjoint Sets.
- Analogy: Imagine a set of 'People who have never seen a cat' and a set of 'People who own only dogs'. These two groups likely don't overlap.
5. Subset (One Inside the Other)
-
If every single element of one set is also an element of another, larger set, then the smaller set is a Subset of the larger one. On a Venn diagram, this looks like one circle completely inside another.
- Analogy: The set of 'All 9th graders' is a subset of the set of 'All High School Students'. Every 9th grader is also a high school student.
- Symbol: We use the symbol '⊆' to denote subset. So, A ⊆ B means "Set A is a subset of Set B."
Venn Diagrams with Two and Three Circles
-
Two Circles: These are the simplest and what we've mostly discussed. They're great for showing the relationship between two categories, like 'Students who play guitar' and 'Students who sing'.
-
Three Circles: These are a bit more complex, with more overlapping regions. They're used when you want to compare three different sets. For example, 'Students who like apples', 'Students who like bananas', and 'Students who like cherries'. You'll see regions for A only, B only, C only, A and B, B and C, A and C, and a central region for A and B and C.
- Analogy: Think of three friends, each with their own unique hobbies, but also some hobbies they share with one friend, and perhaps one super hobby they *all* share!
How to 'Read' a Venn Diagram: A Step-by-Step Guide
- Look at the Universal Set (Rectangle): Understand what the 'big picture' is – what is the total group of things you are considering?
- Identify Each Set (Circles): What does each circle represent? Label them clearly.
- Examine Overlapping Regions (Intersections): These are key! The numbers or elements in these areas belong to *all* the sets whose circles overlap there.
- Look at Non-Overlapping Parts of Circles: The parts of a circle that don't overlap with others represent elements unique to *that* specific set.
- Check the Area Outside the Circles (But Inside the Rectangle): These elements are part of the universal set but do *not* belong to any of the specific sets represented by the circles. This is the complement of the union of all sets.
Why Are Venn Diagrams So Useful?
Venn diagrams are more than just pretty pictures; they are powerful tools for:
- Organizing Information: They help you sort data into clear categories.
- Problem Solving: Many logic puzzles and real-world scenarios become much clearer when visualized with a Venn diagram.
- Making Decisions: By seeing relationships clearly, you can make more informed choices.
- Understanding Complex Ideas: They simplify complex logical relationships into an easy-to-understand visual format.
Think of them as a blueprint for your thoughts, showing how different ideas or groups connect.
Conclusion
Venn diagrams are an essential tool in logical reasoning. They allow us to visually represent sets and their relationships, making complex information digestible and easier to understand. By grasping the concepts of universal sets, individual sets, elements, intersection, union, and complement, you've taken a significant step toward becoming a master of logical thought. Keep practicing, and you'll soon be diagramming your way through any problem!
Keep learning, free
Create a free Syllabax account to unlock practice questions and games for this topic.
Visual Learning Enhanced! 🚀
To help you master this topic, we use Advanced Syllabax AI to generate detailed diagrams and visual models.
Note on Visuals: The AI sometimes makes spelling errors in image labels. Please refer to the lesson text for the correct terminology.