Visualizing Data: Bar Graphs
Watch this topic in 60 seconds
Free preview · Lesson 1
Understanding Visualizing Data: Bar Graphs
Unlocking the Story in Numbers: A Deep Dive into Bar Graphs!
Hey there, future data detectives! Have you ever tried to understand a lot of information all at once? Maybe you want to know which ice cream flavor is most popular in your class, or how many different kinds of pets your friends have. When you have a bunch of information, or "data," it can look like a confusing pile of numbers and words. It's like having a big box of LEGOs – all the pieces are there, but it's hard to see what they're supposed to build!
What is Data, Anyway?
Think of "data" as just information or facts. It could be numbers, like how many points were scored in a game, or words, like your favorite colors. Data is all around us, all the time!
Why Do We Need to "Visualize" Data?
Imagine trying to tell your friend all the details of your favorite movie by just reading them the entire script. It would be super long and hard to follow, right? But if you showed them a movie poster or a trailer, they'd get a quick idea of what it's about! That's what "visualizing" data means – turning boring numbers and words into pictures or graphs so you can understand them quickly and easily. It's like building a LEGO model instead of just looking at a pile of bricks.
Introducing the Bar Graph: Your Data Storyteller!
One of the coolest and easiest ways to visualize data is with something called a **Bar Graph**. Think of a bar graph like a city skyline, where each building represents a different piece of information, and the height of the building tells you how much of that information there is. Or, imagine you're stacking up blocks, and each stack represents something different. The taller the stack, the more blocks you have!
The Essential Parts of a Bar Graph: Let's Break It Down!
Every good story has characters and settings, and a bar graph is no different! Here are the main parts you'll always find:
- The Title: What's the Story About?
- Just like a book needs a title, a bar graph needs one too! The title tells you exactly what the graph is showing. For example, "Favorite Colors in Class 6A" or "Number of Pets Owned by Students." It's the headline that grabs your attention and tells you the main idea.
- The X-axis (Horizontal Axis): The "What" or "Who" We're Counting!
- Imagine a straight line running across the bottom of your graph, from left to right. This is the X-axis. It's where you'll find the different "categories" or types of things you're comparing. Think of it like a street name in our city analogy – it tells you what each building (bar) is about.
- Analogy: If you're counting favorite fruits, the X-axis might have labels like "Apples," "Bananas," "Oranges," and "Grapes." These are the different *types* of fruits.
- The Y-axis (Vertical Axis): The "How Many" or "How Much"!
- Now imagine another straight line going straight up the side of your graph, from bottom to top. This is the Y-axis. This axis usually has numbers on it, showing the "value" or "amount" for each category. Think of it as the measuring tape for our buildings – it tells you how tall each one is.
- Analogy: If your X-axis has "Apples," "Bananas," etc., then the Y-axis would have numbers like 0, 1, 2, 3, 4, 5... telling you *how many* students chose each fruit.
- The Bars: The Main Characters!
- These are the rectangles that shoot up from the X-axis! Each bar represents one of the categories on your X-axis. The most important thing about a bar is its **height**. The taller the bar, the larger the number or amount it represents on the Y-axis.
- Analogy: These are the actual buildings in our city skyline. A super tall skyscraper means many people chose that option, while a short little house means only a few did.
- Bars can be drawn vertically (up and down) or horizontally (sideways), but for foundational learning, we usually focus on vertical bars.
- Labels and Scale: Making Sense of the Numbers!
- The numbers on the Y-axis are called the "scale." It's important that the numbers go up evenly (like 0, 1, 2, 3... or 0, 5, 10, 15...). This helps us accurately compare the heights of the bars. Imagine trying to measure something with a ruler where the inches were all different sizes – it wouldn't work!
- Each axis should also have a label telling you what it represents (e.g., "Number of Students" for the Y-axis, "Types of Fruits" for the X-axis).
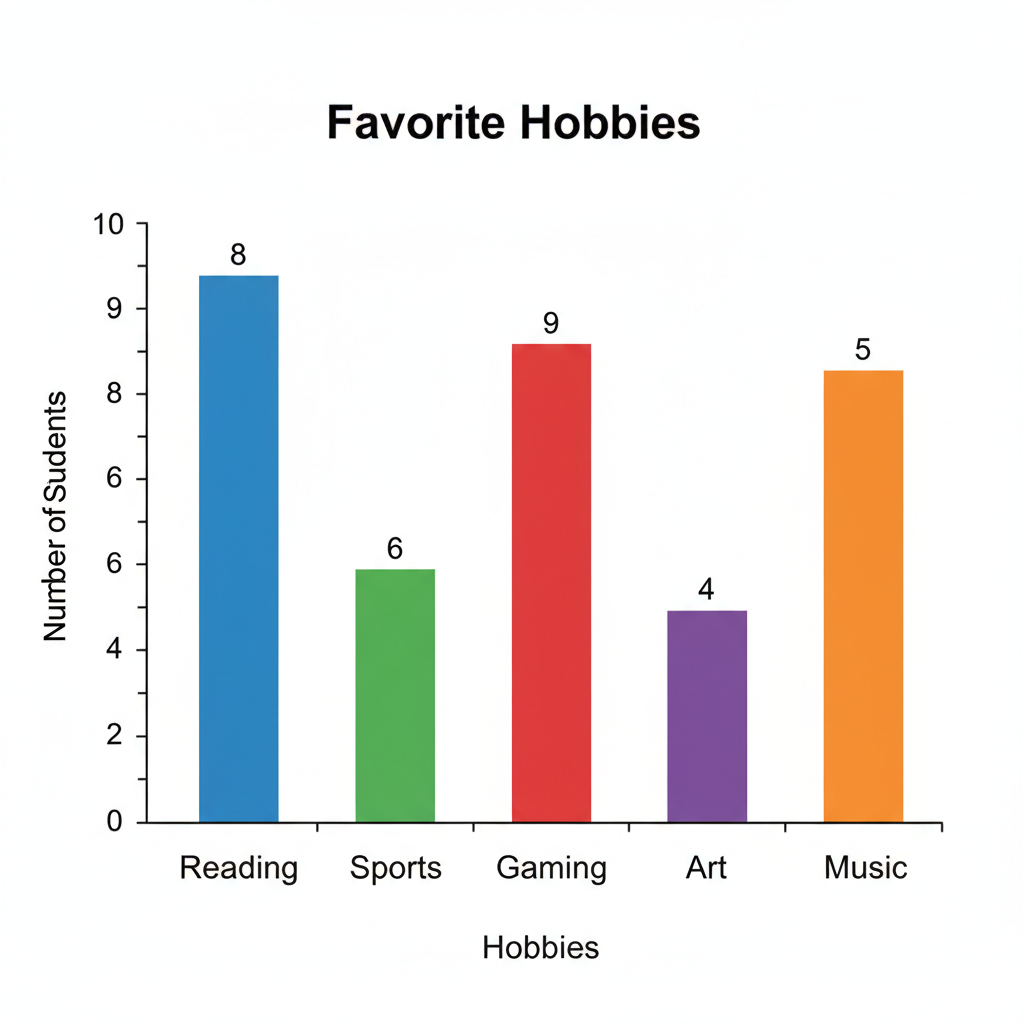
How Do You "Read" a Bar Graph? It's Like Solving a Puzzle!
Once you know the parts, reading a bar graph is super easy. Here's how:
- Look at the Title: First, understand what the graph is about.
- Check the X-axis: See what categories are being compared.
- Check the Y-axis: Understand what the numbers mean (e.g., how many, how much).
- Find a Bar: Choose one of the bars you want to learn about.
- Read Its Height: Follow the top of that bar straight across to the Y-axis. The number it lines up with tells you its value!
- Compare: Now you can easily compare bars! Which bar is tallest? That category has the most. Which is shortest? That category has the least.
Why Are Bar Graphs So Awesome?
- Easy Comparisons: You can see at a glance which category is biggest or smallest. It's much faster than scanning a list of numbers.
- Quick Understanding: They help us understand complex information in a simple, visual way.
- Organized Information: They take messy data and put it into a neat, organized picture.
Let's Practice with an Example!
Imagine a bar graph showing "Favorite Ice Cream Flavors."
- The Title is "Favorite Ice Cream Flavors."
- The X-axis has labels like "Vanilla," "Chocolate," "Strawberry," "Mint."
- The Y-axis is labeled "Number of Students" and goes from 0 to 10.
- If the "Chocolate" bar goes up to the '8' on the Y-axis, it means 8 students chose Chocolate as their favorite.
- If "Vanilla" only goes up to '3', then only 3 students like Vanilla best.
By just looking, you can instantly tell that Chocolate is way more popular than Vanilla! See how powerful a bar graph is?
Bar graphs are everywhere – in news reports, in school projects, even when deciding which toys are most popular. Learning to read them is a super important skill that helps you understand the world around you better. Keep practicing, and you'll be a data master in no time!
Keep learning, free
Create a free Syllabax account to unlock practice questions and games for this topic.
Visual Learning Enhanced! 🚀
To help you master this topic, we use Advanced Syllabax AI to generate detailed diagrams and visual models.
Note on Visuals: The AI sometimes makes spelling errors in image labels. Please refer to the lesson text for the correct terminology.