Range of Data
Watch this topic in 60 seconds
Free preview · Lesson 1
Understanding Range of Data
Unlocking the "Range" of Data: How Spread Out Are Your Numbers?
Hey there, 8th-grade data detectives! Have you ever looked at a bunch of numbers and wondered, "How much do these numbers differ from each other? Are they all really close, or are some super high and some super low?" That's a fantastic question, and today, we're going to uncover a simple yet powerful tool that helps us answer it: the Range of Data.
What is Data, Anyway? (A Quick Refresh)
Before we dive into "range," let's quickly remember what "data" is. Think of data as any information, facts, or numbers that we collect. It could be:
- The number of books your classmates read last month.
- The daily high temperatures for a week in your town.
- The scores you got on your last five math quizzes.
- The height of all the basketball players on a team.
We often collect data to understand things better, make predictions, or compare different situations. But just having a list of numbers isn't enough; we need ways to make sense of them!
Introducing the "Range": The Story of Spread
Imagine you have a group of friends, and you line them up by height. You have the tallest friend and the shortest friend. The "range" is like looking at the difference between the tallest and the shortest. It tells you how much variation or spread there is in the heights of your friends.
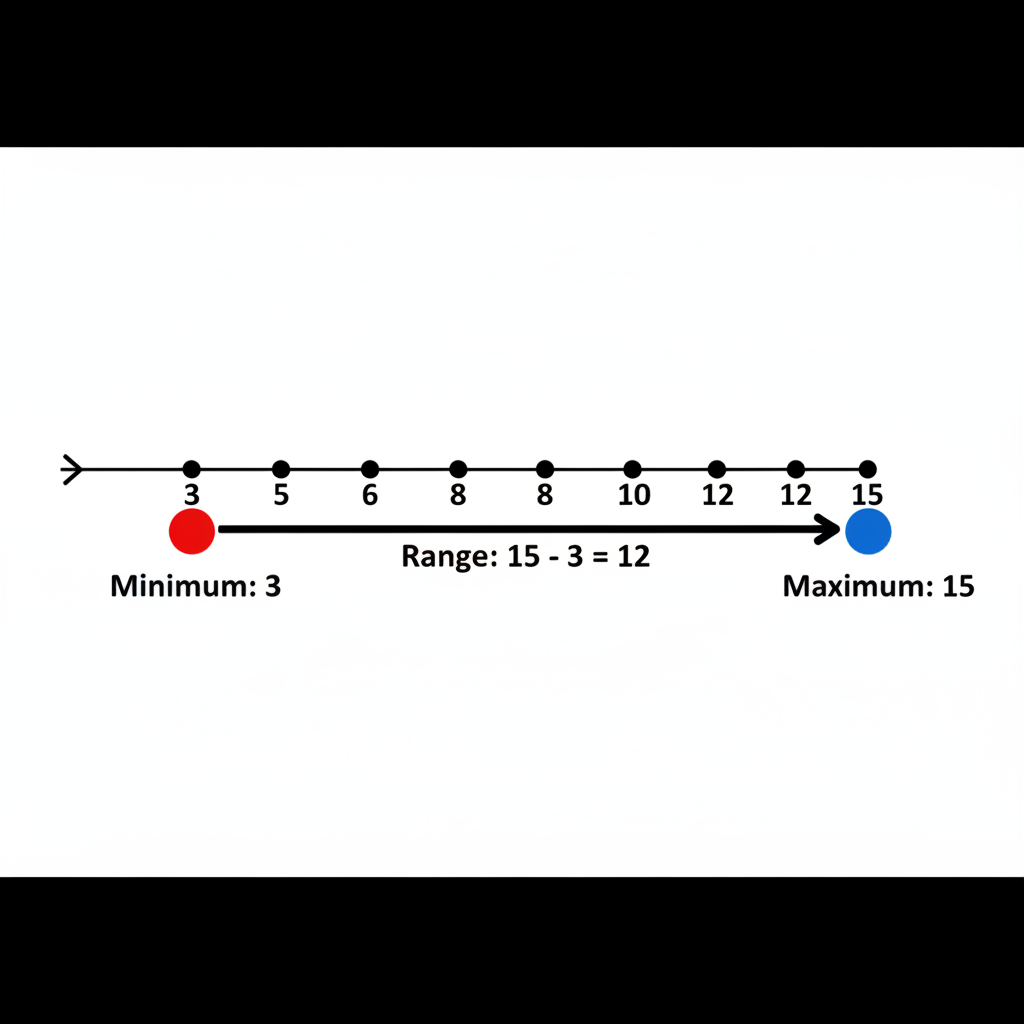
In the world of numbers, the Range is simply the difference between the highest value and the lowest value in a set of data. It's like asking, "What's the gap between the biggest number and the smallest number I have?"
Analogy Time!
- The Rubber Band Analogy: Think of a rubber band. If you have a very stretchy rubber band, you can pull it really wide. That's like a large range – the numbers are very spread out. If you have a tiny, stiff rubber band that hardly stretches, that's like a small range – the numbers are all very close together.
- The Temperature Analogy: Let's say one day the temperature goes from a low of 50°F to a high of 80°F. The range is 30°F. If another day, it only goes from 65°F to 70°F, the range is just 5°F. A bigger range means bigger temperature swings!
- The Test Score Analogy: Your teacher gives back math tests. If the highest score was 100 and the lowest was 20, that's a huge range of 80 points! It means some students did incredibly well, and others struggled quite a bit. If the highest was 95 and the lowest was 85, the range is only 10 points, meaning most students performed similarly.
Why Do We Care About the Range?
The range gives us a quick and easy way to understand the "spread" or "variability" of our data. A large range means the numbers are quite spread out, with a big difference between the smallest and largest. A small range means the numbers are clustered closer together.
- If the range is very small, it might suggest that all the data points are very similar.
- If the range is very large, it means there's a big difference between the extreme values in your data set.
It's like looking at a group of students. If their heights have a small range, they're all roughly the same height. If their heights have a large range, you might have some very tall students and some very short students in the same group.
How Do You Calculate the Range? (It's Super Easy!)
Calculating the range is one of the simplest things you'll do in statistics. It only requires two steps!
- Step 1: Find the Highest Value (Maximum). Look through all your data points and identify the largest number.
- Step 2: Find the Lowest Value (Minimum). Look through all your data points and identify the smallest number.
- Step 3: Subtract! Subtract the lowest value from the highest value.
Range = Highest Value - Lowest Value
Let's Try an Example!
Imagine your class collected data on the number of hours different students spent reading last week:
Data Set: 5, 12, 3, 8, 10, 6, 15
Step 1: Find the Highest Value.
Looking at the numbers (5, 12, 3, 8, 10, 6, 15), the highest value is 15.
Step 2: Find the Lowest Value.
Looking at the numbers again, the lowest value is 3.
Step 3: Subtract!
Range = Highest Value - Lowest Value
Range = 15 - 3
Range = 12
So, the range of reading hours is 12 hours. This tells us that there's a 12-hour difference between the student who read the most and the student who read the least.
Here's a visual to help you understand the concept:
Another Quick Example: Daily Temperatures
Let's say the high temperatures for a week in your city were:
Data Set: 72°F, 78°F, 70°F, 80°F, 75°F, 73°F, 76°F
Highest Value: 80°F
Lowest Value: 70°F
Range: 80 - 70 = 10°F
This means there was a 10-degree difference between the hottest and coolest days that week.
Important Note: Ordering the Data (It Helps, But Isn't Always Necessary for Range)
Sometimes, it helps to put your data in order from smallest to largest before finding the range. This isn't strictly necessary for *just* finding the range (you can often spot the highest and lowest values quickly), but it makes it much easier and helps prevent mistakes, especially with larger data sets. For example, if our reading hours data (5, 12, 3, 8, 10, 6, 15) were ordered, it would be (3, 5, 6, 8, 10, 12, 15). From this ordered list, it's super easy to see that 3 is the minimum and 15 is the maximum.
Putting it all together
The range is your first step in understanding how spread out your data is. It’s a simple calculation that provides a lot of insight. Remember, it’s all about the difference between the extremes – the tallest and shortest, the hottest and coldest, the highest score and the lowest score. Keep practicing, and you'll be a master of data range in no time!
Keep learning, free
Create a free Syllabax account to unlock practice questions and games for this topic.
Visual Learning Enhanced! 🚀
To help you master this topic, we use Advanced Syllabax AI to generate detailed diagrams and visual models.
Note on Visuals: The AI sometimes makes spelling errors in image labels. Please refer to the lesson text for the correct terminology.