Organizing Data: Simple Tables
Watch this topic in 60 seconds
Free preview · Lesson 1
Understanding Organizing Data: Simple Tables
Organizing Data: Simple Tables (Grade 3)
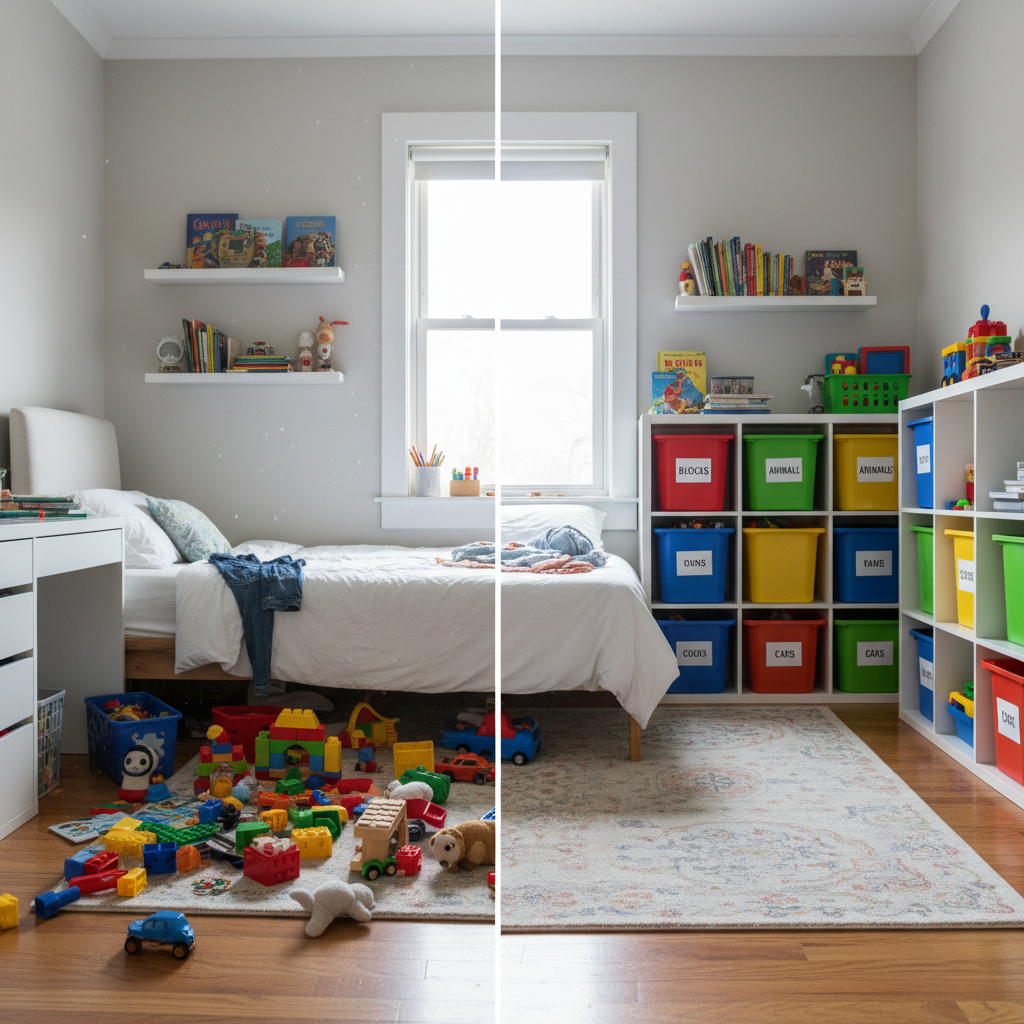
Hey there, young data detectives! Have you ever seen a messy toy box? Toys everywhere – cars, dolls, blocks, all mixed up! It's hard to find your favorite teddy bear when everything is in a big jumble, right? But what if your toy box had special sections, like one spot for cars, another for dolls, and another for blocks? Suddenly, finding your teddy bear (or anything else!) becomes super easy!
That's exactly what we're going to learn about today: Organizing Data using something called a Simple Table. Think of a table as a super-organized toy box for information!
What is Data?
First, let's talk about 'data.' Data is just a fancy word for information or facts. It's like all the different toys in your toy box. For example, 'My favorite color is blue' is a piece of data. 'There are 5 red apples' is another piece of data. 'Our class has 15 boys and 12 girls' is also data. We collect data all the time without even realizing it!
Imagine you ask all your friends what their favorite ice cream flavor is. You might get answers like chocolate, vanilla, strawberry, mint chip, and so on. If you just write them all down on a long, messy list, it's hard to see which flavor is the most popular. It's like trying to count how many red cars are in a giant pile of toys. It would take a long time and be confusing!
 ⚠️ This picture may have spelling mistakes. Trust the words in the lesson.
Why Do We Organize Data?
Just like an organized toy box helps you find things faster, organizing data helps us understand information better and quicker. When data is organized, it's easy to:
- Find things: Want to know how many kids like vanilla ice cream? An organized table will show you right away!
- Compare things: Is chocolate more popular than strawberry? An organized table makes it simple to compare.
- Understand things: When information is neat, it tells a clearer story.
Introducing Simple Tables!
A Simple Table is a special way to organize data in rows and columns. Think of it like a grid or a checkerboard! It helps us put similar information together so it's easy to read and understand.
Rows and Columns: The Building Blocks of Tables
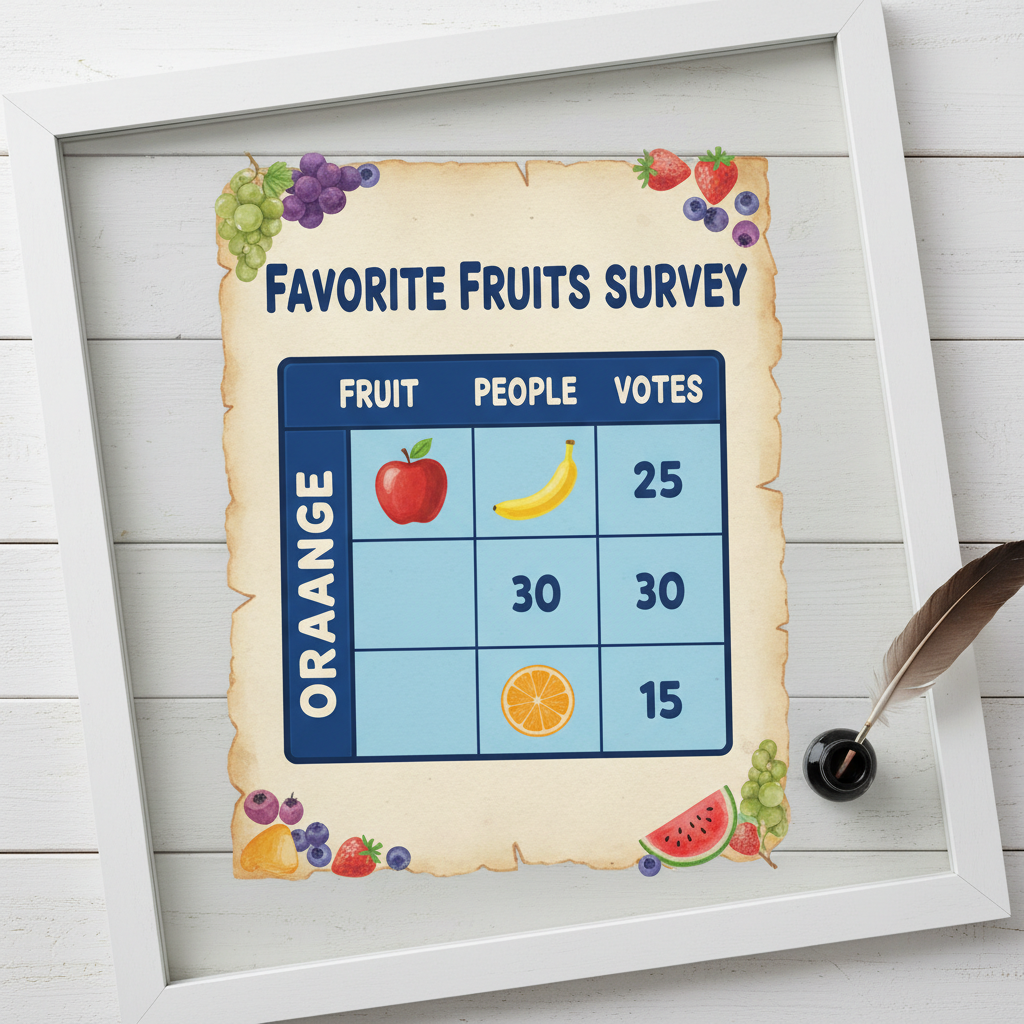
Every table has two main parts: Rows and Columns.
What are Columns?
Imagine a tall building with many windows stacked one on top of the other, going straight up and down. Or think of the strong, tall pillars holding up a roof. Those are like columns! In a table, columns go up and down.
- They help us group information that is of the same type.
- For example, one column might be for 'Favorite Color,' and another column might be for 'Number of Students.'
What are Rows?
Now, imagine walking across a long bridge, or looking at the lines of words in your notebook that go from left to right. Those are like rows! In a table, rows go across, from left to right.
- Each row usually gives you all the information about one specific item or person.
- For example, one row might show all the data for 'Apples,' and another row might show all the data for 'Bananas.'
 ⚠️ This picture may have spelling mistakes. Trust the words in the lesson.
Let's Build a Simple Table!
Let's say we asked our friends what their favorite pet is. Here are their answers:
- Mia: Cat
- Sam: Dog
- Lily: Cat
- Ben: Fish
- Chloe: Dog
- Max: Cat
That's a bit messy, isn't it? Let's use a simple table to organize this data.
Step 1: Decide on your Columns
What kind of information do we have? We have the 'Type of Pet' and we want to count the 'Number of Friends' who like each pet. So, our columns will be 'Favorite Pet' and 'Number of Friends'.
Step 2: List your Categories (Rows)
What are the different types of pets our friends chose? Cat, Dog, and Fish. These will be the categories for our rows.
Step 3: Fill in the Data
Now, let's count and fill in the numbers!
| Favorite Pet (Column 1) | Number of Friends (Column 2) |
|---|---|
| Cat (Row 1) | 3 |
| Dog (Row 2) | 2 |
| Fish (Row 3) | 1 |
Wow! Look how neat and tidy that is! Now, at a quick glance, we can see that 'Cat' is the most popular pet with 3 friends, 'Dog' is liked by 2 friends, and 'Fish' is liked by 1 friend. It's so much easier to understand!
More Analogies for Tables!
- A Calendar: A calendar is a table! The days of the week are columns (like Sunday, Monday, Tuesday...). The weeks going down are like rows. Each little box is a piece of data (the date, or what you have to do that day).
- A Restaurant Menu: Often, a menu is a table! One column might be 'Food Item,' and another column might be 'Price.' Each row is a different dish.
- A Class Roster: A list of students in your class is like a table. Columns might be 'Student Name,' 'Age,' and 'Favorite Subject.' Each row is one student's information.
See? Tables are everywhere! They are super helpful tools for organizing information so we can read it, understand it, and use it easily. Just remember, columns go up and down, rows go across, and together they make data neat and tidy, like an perfectly organized toy box!
Keep learning, free
Create a free Syllabax account to unlock practice questions and games for this topic.
Visual Learning Enhanced! 🚀
To help you master this topic, we use Advanced Syllabax AI to generate detailed diagrams and visual models.
Note on Visuals: The AI sometimes makes spelling errors in image labels. Please refer to the lesson text for the correct terminology.