Measures of Central Tendency: Mode
Watch this topic in 60 seconds
Free preview · Lesson 1
Understanding Measures of Central Tendency: Mode
Understanding the Mode: Finding What's Most Popular!
Welcome, 9th graders! Today, we're diving into a super useful concept in statistics called 'Measures of Central Tendency.' Don't let the fancy name scare you! It simply means different ways to find a 'typical' or 'middle' value in a set of data. Think of it like trying to describe a whole group of friends with just one word – maybe the 'tallest' friend, the 'funniest' friend, or the 'friend who texts the most.' Each of these helps describe the group in a different way.
There are three main 'measures of central tendency' that you'll learn about: the Mean, the Median, and the Mode. Today, our spotlight is entirely on the Mode. It's often the easiest to understand because it's all about popularity!
What Exactly Is the Mode?
Imagine you're trying to figure out the most popular ice cream flavor at a birthday party. You ask everyone what their favorite is, and you write down their answers: Vanilla, Chocolate, Strawberry, Vanilla, Chocolate Chip, Vanilla, Chocolate. If you look closely, you'll see that 'Vanilla' appeared more times than any other flavor. Guess what? Vanilla is the Mode!
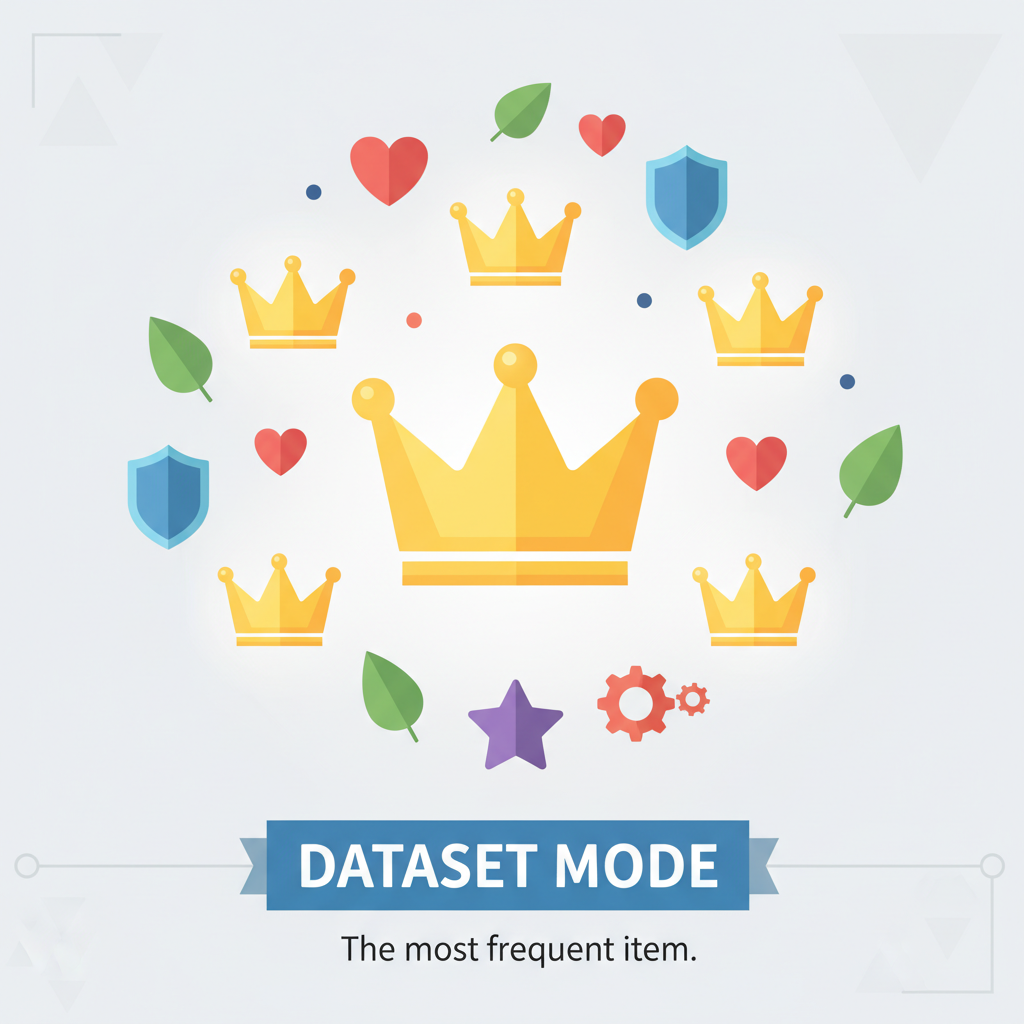
In simple terms, the Mode is the value that appears most frequently in a data set. It's the 'most common' or 'most popular' item, number, or category.
Think of it like a Fashion Trend!
Picture this: a new clothing style suddenly becomes super popular, and you see almost everyone wearing it. That style is the 'mode' in the world of fashion at that moment! It's the most frequently observed outfit. Similarly, if you were to look at the shoe sizes of everyone in your classroom, the shoe size that appears the most times would be the mode for that specific group.
How Do You Find the Mode? (It's Super Easy!)
Finding the mode is like being a detective looking for patterns. Here's your step-by-step guide:
- List Your Data: Write down all the numbers or categories in your data set.
- Count Frequencies: Go through your list and count how many times each unique value appears. A good way to do this is to tally them up.
- Identify the Winner: The value (or values!) that appeared the most times is your mode.
Let's Try Some Examples!
Example 1: Finding a Single Mode
Imagine a group of friends went bowling, and these were their scores: 55, 62, 70, 55, 81, 62, 55
Let's follow our steps:
- Data: 55, 62, 70, 55, 81, 62, 55
- Frequencies:
- 55 appears 3 times
- 62 appears 2 times
- 70 appears 1 time
- 81 appears 1 time
- Winner: The number 55 appeared 3 times, which is more than any other score.
So, the Mode is 55.
Example 2: What if There's a Tie? (Multiple Modes!)
What if, at another bowling game, the scores were: 40, 50, 60, 40, 70, 80, 50
- Data: 40, 50, 60, 40, 70, 80, 50
- Frequencies:
- 40 appears 2 times
- 50 appears 2 times
- 60 appears 1 time
- 70 appears 1 time
- 80 appears 1 time
- Winner: Both 40 and 50 appeared 2 times, which is the highest frequency.
In this case, we have two modes! We call this a bimodal dataset. The Modes are 40 and 50.
It's possible to have even more modes (we call that 'multimodal') if more than two values share the highest frequency.
Example 3: What if Nothing is Popular? (No Mode!)
Consider the ages of students in a small club: 14, 15, 16, 17, 18
- Data: 14, 15, 16, 17, 18
- Frequencies:
- 14 appears 1 time
- 15 appears 1 time
- 16 appears 1 time
- 17 appears 1 time
- 18 appears 1 time
- Winner: Every value appears only once. There's no single value that stands out as 'most frequent.'
Therefore, this dataset has No Mode.
When is the Mode Most Useful?
The mode is especially helpful in situations where you want to know the most common item or category. Think about these scenarios:
- Market Research: A toy company wants to know which color toy car is most popular among kids. They count sales for red, blue, green, and yellow cars. The color with the highest sales is the mode, telling them what to produce more of!
- Surveys: If a school asks students what their favorite subject is (Math, Science, English, Art), the mode would tell them which subject is the crowd favorite.
- Categorical Data: The mode is the ONLY measure of central tendency you can use for data that isn't numbers but categories (like colors, names, types of animals). You can't calculate an 'average' color, right? But you can find the most common one!
Limitations of the Mode
While super easy and useful for categories, the mode isn't always the best fit:
- Doesn't use all data: The mode only cares about the most frequent value, ignoring all the other numbers. This means it might not give a good overall picture of the data if the most frequent value is very far away from most of the other values.
- Can be non-existent or multiple: As we saw, a dataset might have no mode or many modes, which can make it less clear to describe what's 'typical.'
Recap: The Mode in Your Data Toolbox
The mode is a fundamental tool in statistics, especially when you're interested in popularity or working with categories. It tells you 'what's trending' or 'what's most common' in your data. Remember, it's just one piece of the puzzle in understanding a dataset, but it's a powerful one!
Keep practicing identifying the mode, and you'll master this concept in no time!
Keep learning, free
Create a free Syllabax account to unlock practice questions and games for this topic.
Visual Learning Enhanced! 🚀
To help you master this topic, we use Advanced Syllabax AI to generate detailed diagrams and visual models.
Note on Visuals: The AI sometimes makes spelling errors in image labels. Please refer to the lesson text for the correct terminology.