Making Bar Graphs
Watch this topic in 60 seconds
Free preview · Lesson 1
Understanding Making Bar Graphs
Let's Build Bar Graphs: Organizing Our World with Pictures!
Hello, young data detectives! Have you ever tried to figure out which toy you have the most of, or which fruit your family eats most often? Sometimes, just looking at a long list of things can be confusing. It's like having a giant pile of LEGOs all mixed up – it's hard to see how many red ones you have compared to blue ones!
That's where bar graphs come in! Think of a bar graph as a super-organized shelf system for your information. Instead of a messy pile, it helps us see and compare different amounts of things very quickly. It's like having all your red LEGOs stacked neatly on one shelf and all your blue LEGOs on another. Immediately, you can see which stack is taller!
What is a Bar Graph? The Basics!
A bar graph is a special kind of chart that uses rectangles, called 'bars,' to show how much of something there is. The longer or taller the bar, the more of that thing there is. It's like measuring heights! If you have a tall bar for 'apples' and a short bar for 'bananas,' it means you have more apples than bananas.
Why Do We Use Bar Graphs?
- To Compare: They make it super easy to compare different groups. Which pet is most popular? A bar graph can show you in a flash!
- To Understand: They help us understand information (we call this 'data') better than just looking at numbers.
- To Present: They're great for showing your findings to others. Imagine trying to tell someone the results of a class survey just using a list of numbers – boring! A bar graph makes it exciting and clear.
The Essential Parts of a Bar Graph (Our Shelf System Analogy!)
Just like a good shelf system needs sturdy shelves and labels, a bar graph has several important parts:
1. The Title: What's This All About?
Every bar graph needs a title. The title tells us what information the graph is showing. It's like the label on a box that says, "Toys!" or "Snacks!" Without it, you wouldn't know what's inside!
Analogy: Imagine you're making a drawing. The title is like the sentence you write at the top that says, "My Favorite Animals" or "Our Class's Favorite Colors." It gives everyone an idea of what they're looking at.
2. The Axes: Our Sturdy Shelves!
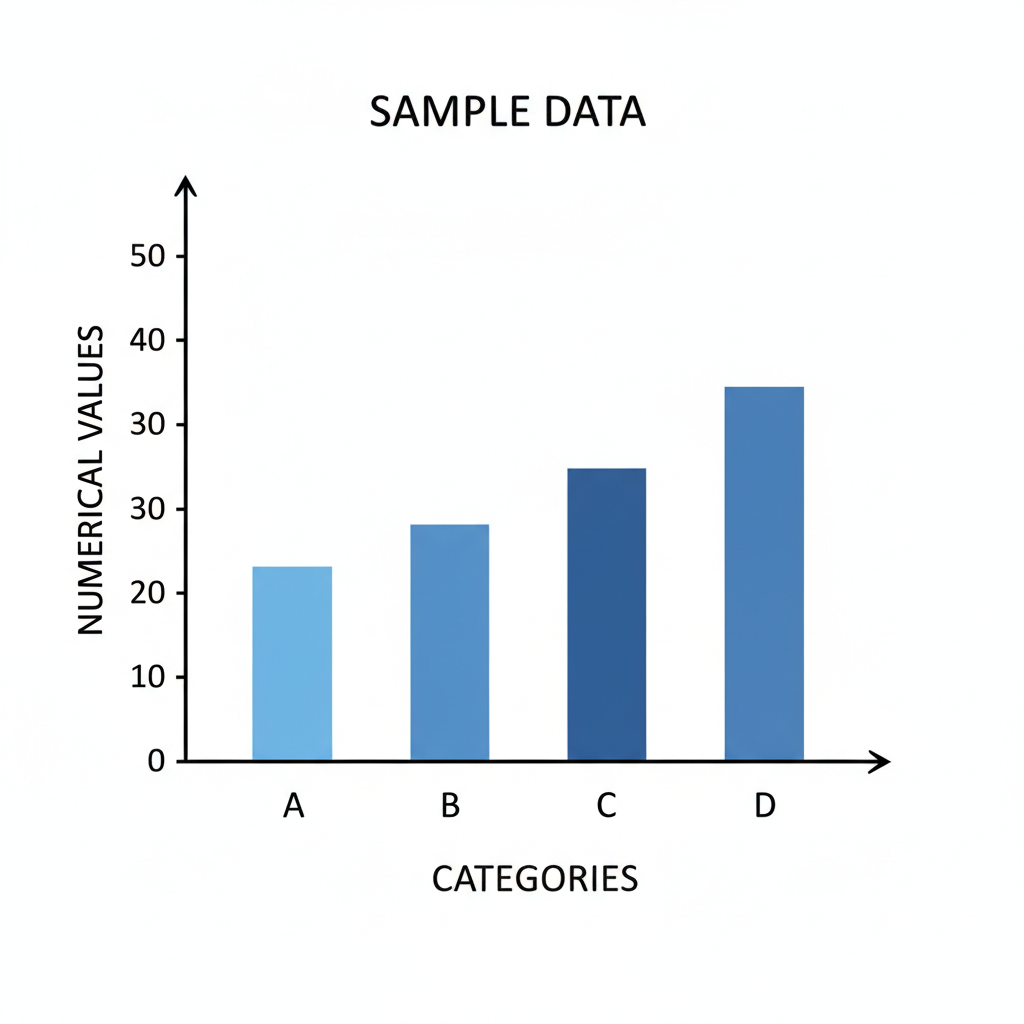
Bar graphs have two main lines that look like a giant 'L' shape. These are called axes (pronounced: AK-sees). They are the foundational lines that everything else is built upon.
- Horizontal Axis (X-axis): This is the line that goes sideways, like the floor you walk on. It's where you put the categories or groups of things you are comparing.
- Vertical Axis (Y-axis): This is the line that goes up and down, like a tall wall. It's where you show the amount or number of things.
Analogy: Think of the horizontal axis as the bottom shelf where you line up your different types of toys (like cars, dolls, blocks). The vertical axis is like a ruler going up the wall behind your shelves, showing how many of each toy you have stacked up!
3. Labels: What's On Our Shelves?
Just having shelves isn't enough; we need to know what's on them! Each axis needs a label to tell us what it represents.
- Horizontal Axis Label: This label tells you what the different groups are. For example, if you're graphing favorite colors, this label might say "Favorite Colors," and the individual categories below it would be "Red," "Blue," "Green," etc.
- Vertical Axis Label: This label tells you what the numbers going up the side mean. If you're counting students, this label would say "Number of Students."
Analogy: If you have a shelf for 'Cars' and a shelf for 'Dolls,' those are the labels for your categories. The label 'Number of Toys' on the wall ruler tells you what those numbers (1, 2, 3...) actually mean.
4. The Scale: Our Measuring Stick!
The scale is the set of numbers along the vertical axis (the up-and-down one). It tells us how much each mark on the axis represents. The numbers must go up in even steps (like counting by 1s, 2s, 5s, or 10s). You wouldn't count 1, 3, 4, 10, would you? That would be confusing!
Analogy: The scale is like a ruler or a measuring tape. When you measure something, the marks on the ruler go up by 1 inch, then 2 inches, then 3 inches, and so on. They don't jump around randomly. Our bar graph scale needs to be just as neat and consistent.
5. The Bars: Our Stacks of Information!
Finally, we have the bars themselves! These are the colored rectangles that shoot up from the horizontal axis. Each bar represents a different category, and its height tells us the amount for that category, measured against the vertical scale.
Analogy: The bars are like those neat stacks of LEGOs or books on your shelves. If you have 10 red LEGOs, the 'Red LEGOs' bar will go up to the number 10 on your measuring stick (the vertical axis). If you have 5 blue LEGOs, the 'Blue LEGOs' bar will only go up to the number 5.
Let's Make a Bar Graph Together!
Imagine your class voted on their favorite ice cream flavors. Here's the data:
- Chocolate: 8 students
- Vanilla: 6 students
- Strawberry: 4 students
- Mint Chip: 2 students
- Title: First, we need a great title: "Favorite Ice Cream Flavors in Our Class."
- Axes and Labels: We draw our 'L' shape. The horizontal axis will be for the "Ice Cream Flavors." The vertical axis will be for "Number of Students."
- Scale: Since our numbers go from 2 to 8, we can count by 1s or 2s up the vertical axis. Let's go by 2s: 0, 2, 4, 6, 8, 10.
- Bars: Now we draw our bars!
- For Chocolate (8 students), we draw a bar up to the '8' mark on the vertical axis.
- For Vanilla (6 students), we draw a bar up to the '6' mark.
- For Strawberry (4 students), we draw a bar up to the '4' mark.
- For Mint Chip (2 students), we draw a bar up to the '2' mark.
And there you have it! A perfectly organized bar graph that instantly shows Chocolate is the most popular, and Mint Chip is the least popular. See how easy it is to compare when everything is neatly stacked?
Your Turn to Be a Bar Graph Builder!
Remember, making a bar graph is like telling a story with pictures and numbers. It helps us understand and share information in a clear, simple, and fun way. Keep practicing, and you'll be a bar graph expert in no time!
Keep learning, free
Create a free Syllabax account to unlock practice questions and games for this topic.
Visual Learning Enhanced! 🚀
To help you master this topic, we use Advanced Syllabax AI to generate detailed diagrams and visual models.
Note on Visuals: The AI sometimes makes spelling errors in image labels. Please refer to the lesson text for the correct terminology.