Our Favorite Things Survey
Watch this topic in 60 seconds
Free preview · Lesson 1
Understanding Our Favorite Things Survey
Our Favorite Things Survey!
Hey everyone! Imagine you want to know what kind of snack everyone in your class likes best for a party. Should you just guess what everyone wants? Or maybe just pick your own favorite? No! A smart and fair way to find out what everyone likes is to ask them! This special way of asking questions to a group of people is called a survey!
What is a Survey?
Think of a survey like being a super-curious detective, but instead of looking for clues about a mystery, you're looking for clues about people's favorite things, their ideas, or what they like to do! A survey is simply asking a bunch of people questions to learn about them as a group.
- Why do we do surveys? We do surveys because they help us make fair choices, plan fun activities that everyone will enjoy, or simply understand our friends and classmates better. It's a great way to make sure everyone feels heard!
Step 1: Asking Good Questions
The very first part of doing a survey is to think of a clear and interesting question. This question should be something you want to learn about!
- Examples of good survey questions for a second grader:
- "What is your favorite color?"
- "What is your favorite animal?"
- "What is your favorite fruit for snack time?"
- "What game do you like to play most at recess?"
It's important to make sure everyone understands your question. If someone is confused, your survey results might not be right!
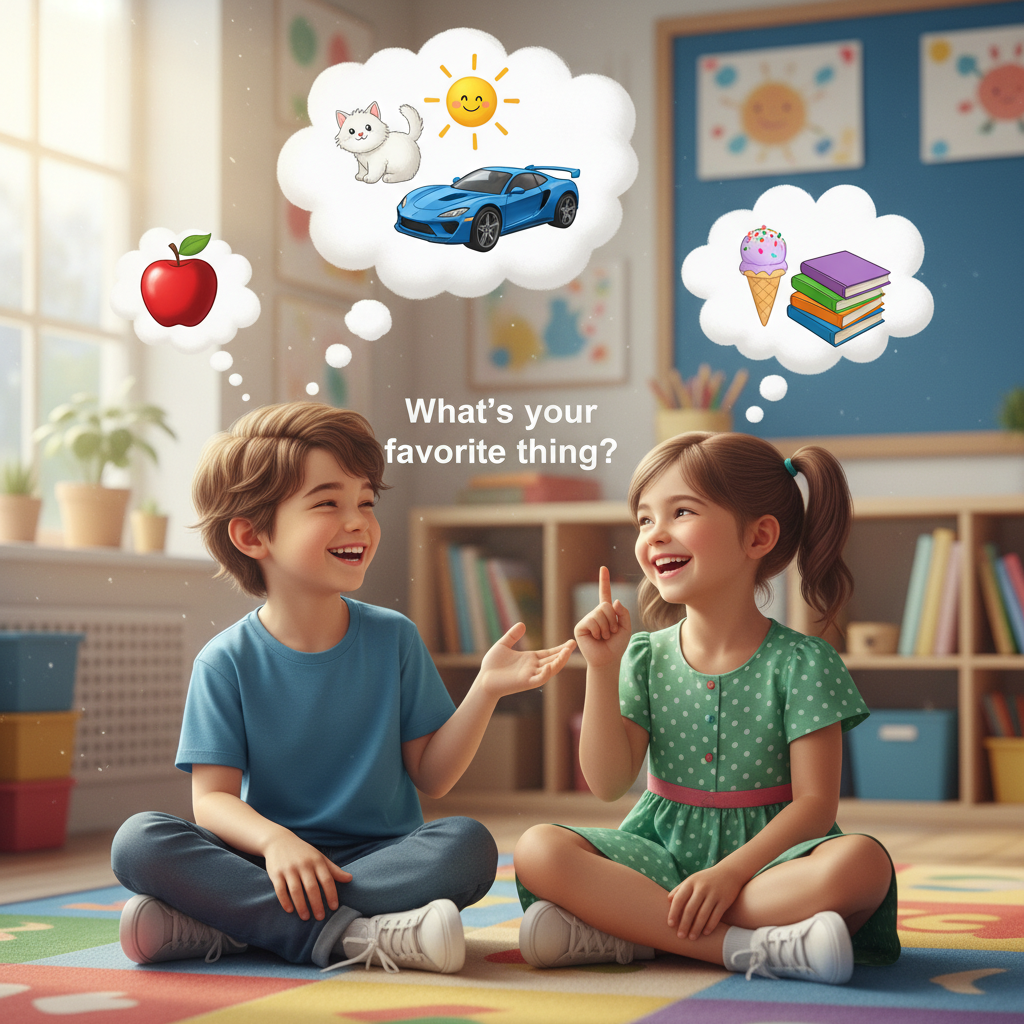
Step 2: Giving Choices (Options)
Sometimes, it's really helpful to give people a few choices for their answer. This makes it easier for them to answer and for you to collect their answers.
- Analogy: Imagine you're at an ice cream shop, and the grown-up asks, "Do you want chocolate, vanilla, or strawberry?" Giving you choices makes it easy to pick!
- For example, if your question is "What is your favorite color?", you might offer choices like Red, Blue, Green, or Yellow. If you didn't give choices, someone might say "periwinkle" and that might be harder to count with all the other unique answers!
Step 3: Collecting the Answers (This is Called Data!)
Once you ask your question and people pick their answer, you need to write down what they say. All the information you collect from your survey is called data.
- Analogy: "Data" is just a fancy word for all the pieces of information or "treasures" you find out from your survey!
The easiest and most fun way for a second grader to collect answers is by using tally marks!
- A tally mark is just a little line ( | ).
- Every time someone picks an answer, you draw one line next to that choice.
- When you get to five tally marks for one choice, you don't just keep making lines straight up and down. Instead, you draw a line diagonally across the first four ( |||| with a slash across them). This makes a little "gate" or "bundle" of five.
- Why do we make bundles of five? Because it makes counting much, much easier and faster later on!
- Example: Favorite Fruit
- Apple: |||| | (This bundle and one extra line means 6 people like apples)
- Banana: ||| (This means 3 people like bananas)
- Orange: |||| (This means 4 people like oranges)
- Analogy: Using tally marks is like grouping your Lego bricks or toy cars into piles of five. It's much easier to count your whole collection if they're in neat piles!
Step 4: Organizing the Answers (Making it Neat!)
After you've collected all your tally marks, your data might look a little messy. The next step is to make it super neat and easy to understand! This is called organizing data.
Two fantastic ways to organize data for a second grader are using a Tally Chart and a Picture Graph (sometimes called a Pictograph).
Using a Tally Chart
A tally chart is a neat table where you put your survey question, the choices, the tally marks you collected, and then the total number for each choice.
| Favorite Color | Tally Marks | Total Number |
|---|---|---|
| Red | |||| | 4 |
| Blue | |||| | | 6 |
| Green | || | 2 |
See how easy it is to see the numbers now?
Using a Picture Graph (Pictograph)
Picture graphs are super fun because they use little pictures or symbols to show how many people chose each answer! It's like telling a story with drawings instead of just numbers.
- Key or Legend: Every picture graph needs a "key" or "legend." This key tells you what one picture stands for. Most of the time, one picture means one person, but sometimes it can mean 2 people or even more!
Example: Favorite Pet (Let's say one star ⭐ means one person.)
| Pet | Number of Friends |
|---|---|
| Dogs | ⭐ ⭐ ⭐ ⭐ ⭐ |
| Cats | ⭐ ⭐ ⭐ |
| Fish | ⭐ ⭐ |
In this graph, we can quickly see that 5 people like dogs, 3 like cats, and 2 like fish. It's like a picture puzzle where the pictures tell you the numbers!
Step 5: Reading and Understanding the Answers
Now that your data is all neat and organized in a chart or graph, it's time for the most exciting part: reading and understanding what it tells you! This means looking at your organized information and figuring out what story it tells.
- Analogy: Reading your survey results is like finding the "answer" to your detective mystery! You've collected all the clues, put them in order, and now you know the whole story.
Here are some questions you can ask your organized data:
- Which choice did the most people pick? (This is the most popular choice!)
- Which choice did the fewest people pick? (This is the least popular choice!)
- How many more people picked this than that? (You can compare two different choices by subtracting the smaller number from the larger number.)
- How many people answered the survey in total? (You can add up all the total numbers to find out how many people took part!)
Let's use our Favorite Color Tally Chart example from above:
- Which color is most popular? Blue (with 6 votes!)
- Which color is least popular? Green (with only 2 votes!)
- How many more people like blue than red? Blue had 6 votes, Red had 4 votes. So, 6 - 4 = 2 more people like blue than red.
- How many people took the survey? 4 (Red) + 6 (Blue) + 2 (Green) = 12 people took the survey in total.
Why are Surveys Awesome?
Surveys are a wonderful tool because:
- They help us make decisions that are fair and make many people happy.
- They help us understand what our friends, classmates, or family members enjoy and care about.
- They're a super fun way to practice important skills like counting, organizing, comparing numbers, and even a little bit of addition and subtraction!
So, the next time you're curious about what a group of people likes or thinks, try doing a survey! It's a great way to learn and have fun at the same time!
Keep learning, free
Create a free Syllabax account to unlock practice questions and games for this topic.
Visual Learning Enhanced! 🚀
To help you master this topic, we use Advanced Syllabax AI to generate detailed diagrams and visual models.
Note on Visuals: The AI sometimes makes spelling errors in image labels. Please refer to the lesson text for the correct terminology.