Learning Journey
Watch this topic in 60 seconds
Free preview · Lesson 1
Understanding Interpreting Bar Graphs
Unlocking Bar Graphs: Your Data Detective Guide!
Hello, future data detectives! Have you ever seen a drawing with colorful blocks of different heights, showing things like 'Favorite Ice Cream Flavors' or 'Number of Pets'? Those colorful blocks are part of something super useful called a bar graph! Bar graphs are like special pictures that help us understand information (or 'data') quickly and easily. Think of them as a visual way to count and compare things without using lots of words or confusing lists of numbers.
Imagine you're trying to figure out which sport is most popular in your class. You could ask everyone and write down their answers, but looking at a long list of names and sports would be a bit messy. A bar graph takes all that messy information and turns it into a clear, organized picture, making it super easy to spot the 'winner' or the 'loser' at a glance. It's like having a superpower to see patterns and compare numbers!
What is a Bar Graph? The Basics!
At its heart, a bar graph uses rectangles (called 'bars') to show how much or how many of different things there are. The length or height of each bar tells you its value. The longer or taller the bar, the more of that thing there is!
Let's break down the main parts of a bar graph, like learning the parts of a bicycle before you ride it:
-
Title: The Name of the Game!
Every good bar graph needs a title. Just like a book has a title to tell you what it's about, a bar graph's title tells you what kind of information you're looking at. For example, a title might be 'Favorite Colors of 6th Graders' or 'Books Read This Month'. Without a title, you'd be looking at bars and numbers and wondering, 'What am I even looking at?!'
-
Axes: The Roads and Rulers!
A bar graph has two main lines, called axes (pronounced 'ax-eez'). Think of them as the 'roads' where the information travels:
-
Horizontal Axis (X-axis): The Category Road
This is the line that goes sideways, from left to right, like the horizon line where the sky meets the ground. It usually lists the different categories or types of things you are comparing. If you're graphing favorite colors, the categories might be 'Red,' 'Blue,' 'Green,' and 'Yellow.' Imagine these as different shelves in a store, each holding a different type of toy. -
Vertical Axis (Y-axis): The Amount Ruler
This is the line that goes up and down, like a tall building. It usually has numbers that show the amount or frequency (how many) of each category. This is like a ruler that tells you how tall each 'toy stack' is. These numbers usually start at zero and go up in even steps (like 0, 1, 2, 3... or 0, 5, 10, 15...). This is called the scale.
-
-
Labels: What Are We Measuring?
Each axis has labels that tell you what it represents. The horizontal axis might be labeled 'Colors' and the vertical axis might be labeled 'Number of Students'. These labels are super important because they help you understand what the categories and numbers mean.
-
Bars: The Data Skyscrapers!
And finally, the stars of the show: the bars! These are the rectangles that shoot up (or sometimes sideways) from the categories on the horizontal axis. Each bar represents one category. The higher (or longer) a bar is, the greater the value for that category. It's like each bar is a skyscraper, and its height tells you how popular or how much of something there is.
-
Scale: The Measuring Tape!
The scale on the vertical axis is like the measuring tape for your bars. It shows you what each line or mark on the axis represents. For example, if the scale goes up by 5s (0, 5, 10, 15...), it means each major line or tick mark represents 5 units. It helps you accurately read the height of each bar. If the scale wasn't there, you wouldn't know if a bar reaching a certain height meant '2 people' or '200 people'!
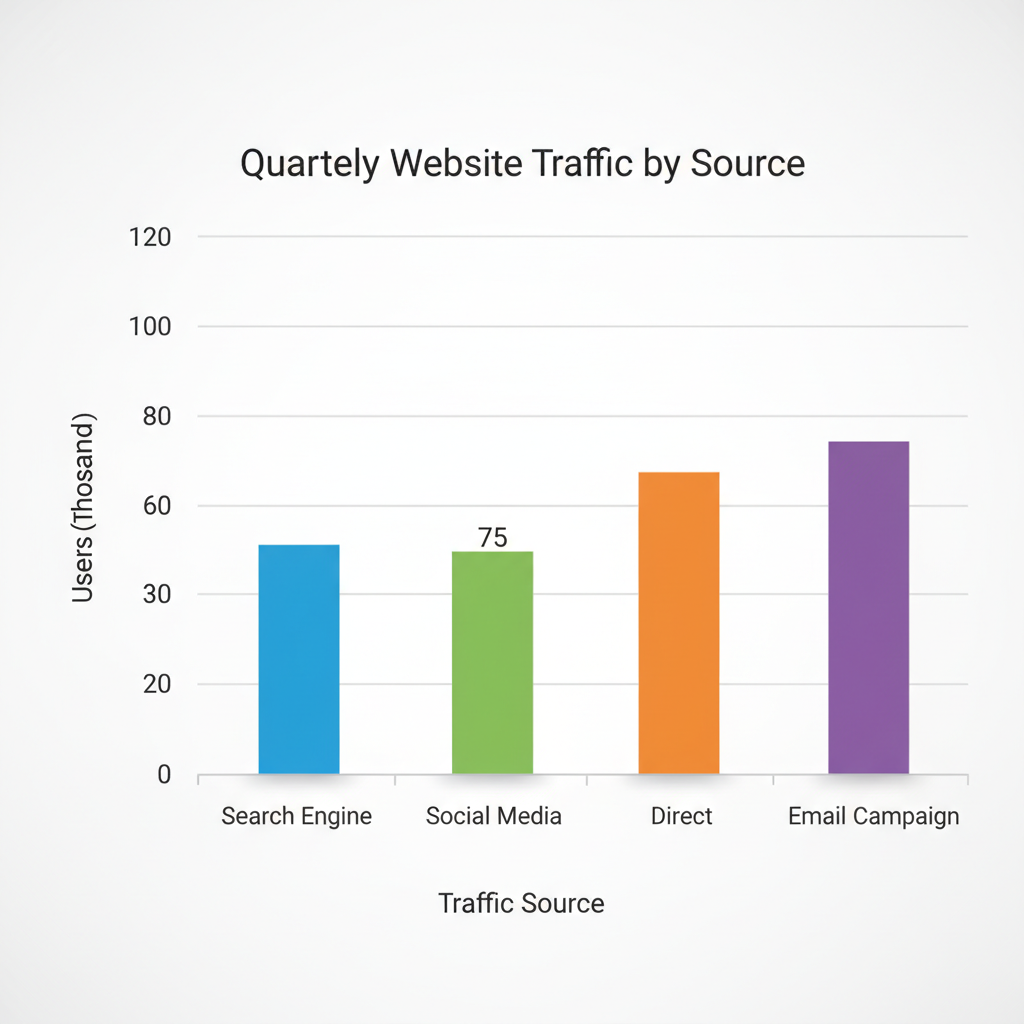 ⚠️ This picture may have spelling mistakes. Trust the words in the lesson.
How to Be a Bar Graph Detective: Interpreting the Clues!
Now that you know the parts, let's learn how to 'read' a bar graph. It's like solving a puzzle, and with practice, you'll be a pro!
-
Reading a Single Bar: What Does One Bar Tell Us?
To find the value for a specific category, simply find that category on the horizontal axis. Then, trace your finger (or eyes!) straight up the bar until you reach its top. From the top of the bar, look straight across to the vertical axis (the one with the numbers). The number your finger lands on is the value for that category. For instance, if the 'Blue' bar reaches the '7' on the vertical axis, it means 7 students chose blue as their favorite color.
-
Comparing Bars: Who's the Winner? Who's the Loser?
This is where bar graphs really shine! To compare two or more categories, just look at their bars. The taller bar represents a larger quantity, and the shorter bar represents a smaller quantity. If the 'Chocolate' ice cream bar is much taller than the 'Vanilla' bar, you immediately know chocolate is more popular. You can even find the difference by subtracting the value of the shorter bar from the value of the taller bar!
Analogy: Imagine you have several towers made of building blocks. To see which tower has more blocks, you just look at their heights! The tallest tower has the most blocks, and the shortest has the fewest. Bar graphs work the same way!
-
Finding Totals: How Many in All?
Sometimes, you might need to find the total number of items across several categories. To do this, simply read the value for each bar you are interested in (using the method above) and then add those values together. If 5 students chose red and 7 chose blue, the total number of students who chose either red or blue is 5 + 7 = 12.
-
Identifying 'Most' and 'Least': The Quick Scan!
One of the quickest things a bar graph tells you is which category has the most or the least. Just look for the tallest bar – that's the 'most'! Look for the shortest bar – that's the 'least'! It's like finding the highest and lowest mountain peaks in a mountain range.
Practice Makes Perfect!
Reading bar graphs is a skill, just like riding a bike or playing a video game. The more you practice, the better you'll become! Next time you see a bar graph in a book, online, or on TV, take a moment to be a data detective. Look at the title, identify the axes, read the labels, and compare the bars. You'll be amazed at how much information you can unlock!
Remember, bar graphs are powerful tools for understanding the world around us. They turn messy numbers into clear, colorful stories. Keep exploring, keep questioning, and soon you'll be a master at interpreting all kinds of graphs!
Keep learning, free
Create a free Syllabax account to unlock practice questions and games for this topic.
Visual Learning Enhanced! 🚀
To help you master this topic, we use Advanced Syllabax AI to generate detailed diagrams and visual models.
Note on Visuals: The AI sometimes makes spelling errors in image labels. Please refer to the lesson text for the correct terminology.