Representing Data with Objects
Watch this topic in 60 seconds
Free preview · Lesson 1
Understanding Representing Data with Objects
Making Sense of Stuff: Using Objects to Show Data!
Have you ever wondered how many of your friends like pizza, or how many red cars are in the school parking lot? All that 'stuff' is called data! Data is just information or facts we collect. When we collect data, it can sometimes look like a big messy pile, just like a pile of all your toys mixed together. It's hard to tell what you have!
That's where representing data comes in. It means showing your information in a clear and organized way so that it's easy to understand and talk about. Imagine you sort your toy cars by color, or your LEGO bricks by size – suddenly, you can see everything much better! Today, we're going to learn about a super fun and hands-on way to represent data: by using objects!
What Does "Representing Data with Objects" Mean?
Sometimes, we use pictures or bars on a graph to show data. But what if we used *actual physical things*? That's exactly what "representing data with objects" means! We use real, touchable items to stand for information. It's like building your data instead of just drawing it!
What Kinds of "Objects" Can We Use?
When we say "objects," we mean small, similar items that you can count and arrange. Think of things like:
- Small blocks (like LEGOs or building blocks)
- Counting bears or small toy figures
- Pebbles or small rocks
- Stickers (if you stick them on paper in rows!)
- Buttons
- Craft sticks or popsicle sticks
- Even small erasers or pieces of candy (if your teacher says it's okay!)
The most important rule is that usually, one object stands for one piece of information. So, if 5 friends like apples, you'll need 5 objects for the "apples" group.
Analogy Time! Let's See Objects in Action!
Analogy 1: Favorite Colors with Toy Blocks
Imagine you want to know what your classmates' favorite colors are. You could ask everyone and just write down their answers, but then you'd have a long list. It would be hard to quickly see which color is the most popular.
Instead, let's use toy blocks! You could have a pile of red, blue, green, and yellow blocks. Here's how it works:
- When Maria says her favorite color is red, you put out a red block.
- When Tom says his favorite color is blue, you put out a blue block.
- You keep doing this for everyone in your class.
After everyone has shared, you'll have a collection of blocks. If you arrange all the red blocks together, all the blue blocks together, and so on, you've created an object graph! It's so easy to see which color has the longest line of blocks, meaning it's the most popular!
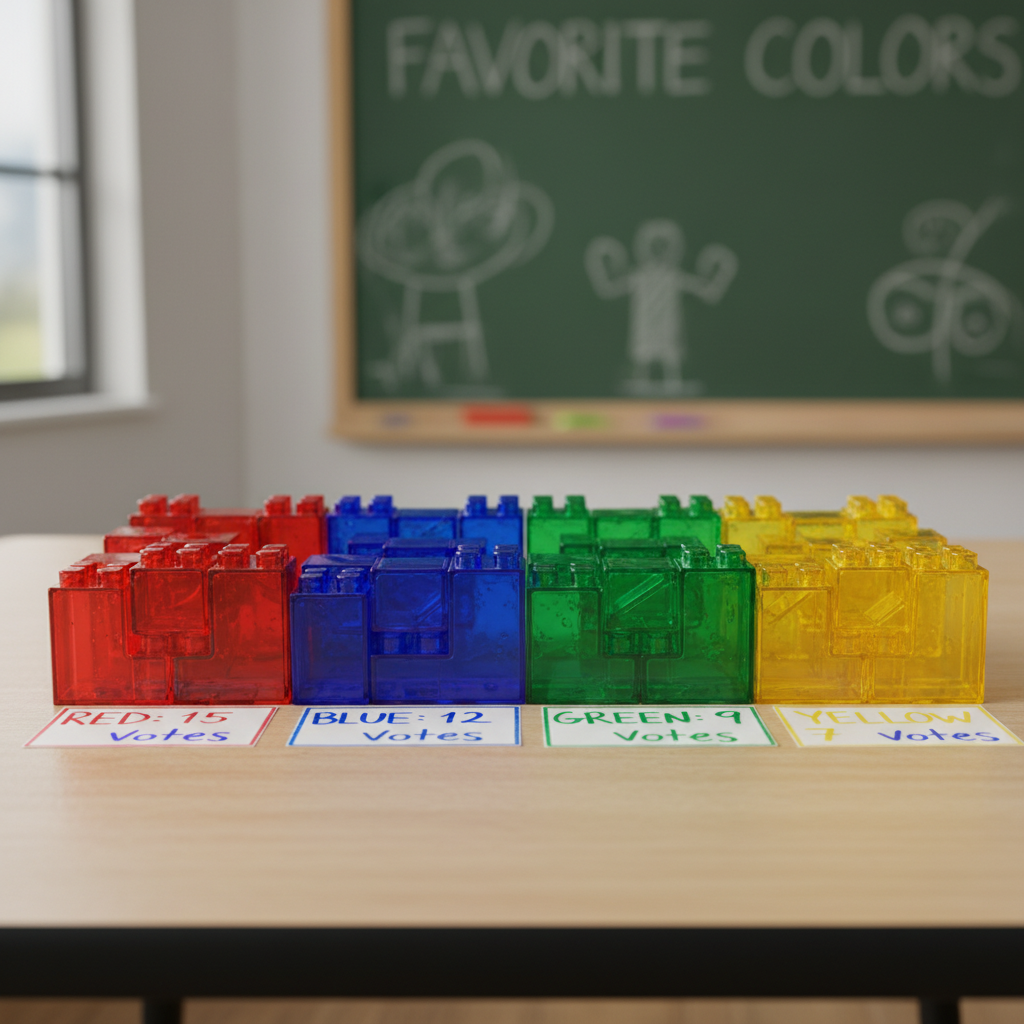
This image shows how different colored blocks can be sorted into rows. Each block stands for one person's favorite color. It's easy to see which row is longest!
Analogy 2: Types of Pets with Craft Sticks
Let's try another example! What if you wanted to find out what kinds of pets your friends have: dogs, cats, fish, or birds? You could choose different colored craft sticks to represent each type of pet:
- Blue stick for a dog 🐶
- Red stick for a cat 🐱
- Green stick for a fish 🐠
- Yellow stick for a bird 🐦
Every time a friend tells you they have a dog, you add a blue stick to the "dogs" pile. If another friend has a cat, you add a red stick to the "cats" pile. When you're done, you arrange the sticks in neat lines. Now you can quickly count how many blue sticks (dogs) there are, or how many red sticks (cats), and compare them easily!
How to Build Your Own Object Graph (Step-by-Step)
Ready to try making one yourself? Here's how:
-
Ask a Question: First, decide what information (data) you want to find out. For example: "What is everyone's favorite snack?" or "How many students have birthdays in each season?"
-
Gather Your "Objects": Find a good amount of small, similar items. Buttons, paperclips, small erasers, or even dried beans work great!
-
Collect the Data & Place Objects: Now, ask your question to your classmates, friends, or family! As each person answers, put one object in the correct group. For example, if you're asking about favorite snacks:
- If someone says "apples," put one button in the "apples" area.
- If someone says "crackers," put one button in the "crackers" area.
- Remember: one object = one piece of information!
-
Arrange Your Objects Neatly: Once you've collected all the data, arrange your objects. Put all the buttons for "apples" together in one neat row or column. Do the same for "crackers," "bananas," and so on. Make sure they line up so it's easy to compare their lengths.
-
Label It! This is super important! Don't forget to write down what each line of objects means (e.g., "Apples," "Crackers," "Bananas"). Also, give your whole graph a title, like "Our Class's Favorite Snacks!" This helps everyone understand what your graph is showing.
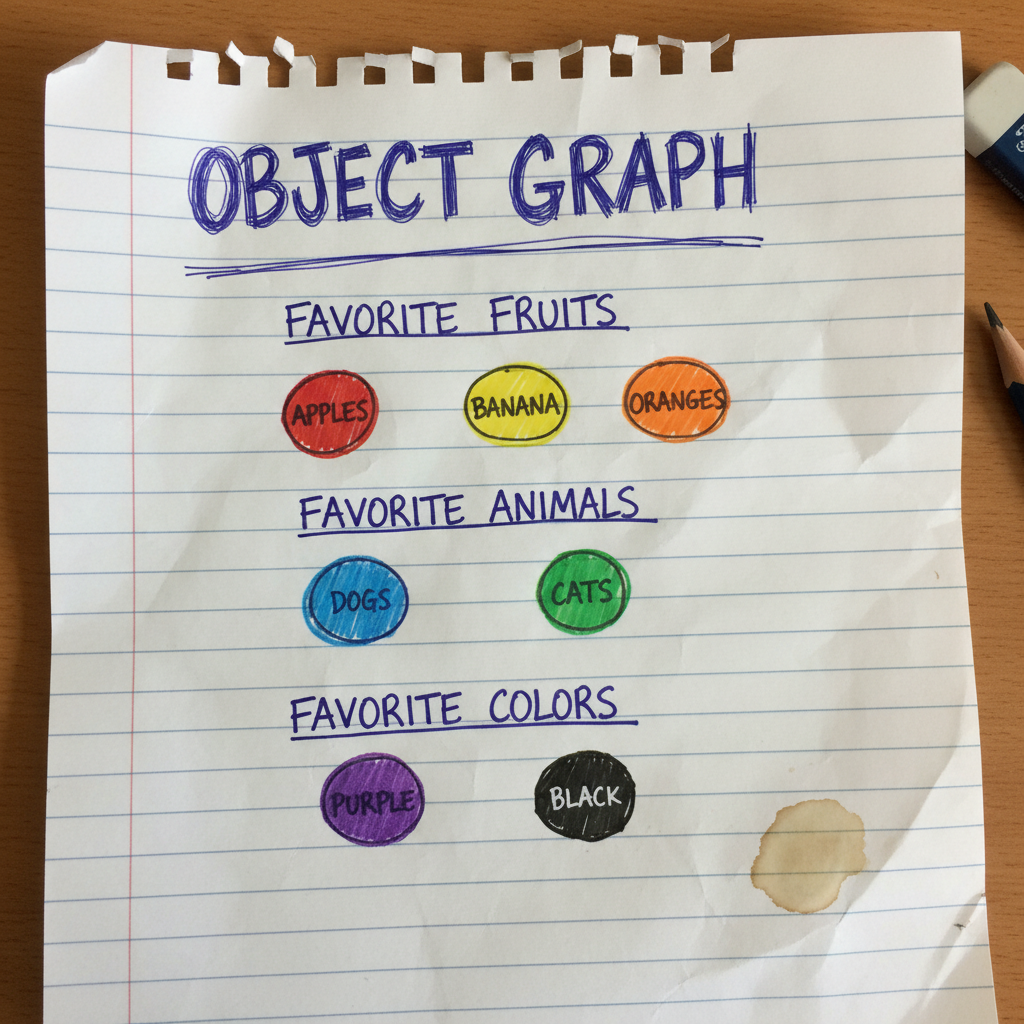
This image shows an organized object graph with labels. You can see how the objects (buttons) are lined up, making it easy to count and compare the numbers in each category.
Reading Your Object Graph: What Can You Learn?
Once your object graph is built, it's like a secret decoder for information! You can easily find answers to questions like:
- Which category has the most? Just look for the longest line of objects!
- Which category has the least? Look for the shortest line of objects.
- How many are in each category? Simply count the objects in that line.
- How many more or less? Count the difference between two lines of objects.
- What is the total? Count ALL the objects in your graph!
Why Is Representing Data with Objects So Helpful?
Using objects to show data is a fantastic way to learn because:
- It's Hands-On! You can physically touch, move, and count the items, which makes learning more fun and memorable.
- Easy to Understand: Even without lots of numbers, you can see and compare information just by looking at the lengths of the rows. It's very visual!
- Makes Comparisons Simple: It's super quick to tell which group is bigger or smaller just by glancing at the lines of objects.
- Connects to Real Life: It helps you understand how people organize information all around you, from store shelves to your own toy box.
So, the next time you have a bunch of information, remember that you can use everyday objects to sort it out and make it easy for everyone to understand! It's like organizing your toys so you can easily see what you have!
Keep learning, free
Create a free Syllabax account to unlock practice questions and games for this topic.
Visual Learning Enhanced! 🚀
To help you master this topic, we use Advanced Syllabax AI to generate detailed diagrams and visual models.
Note on Visuals: The AI sometimes makes spelling errors in image labels. Please refer to the lesson text for the correct terminology.