Grouping Data into Categories
Watch this topic in 60 seconds
Free preview · Lesson 1
Understanding Grouping Data into Categories
Grouping Data into Categories: Making Sense of Our World!
Hey there, young data detectives! Have you ever had a giant pile of toys, clothes, or school supplies and felt a little overwhelmed? It’s hard to find anything when everything is mixed up, right? Well, guess what? Our world is full of information, and sometimes it can feel just like that giant, messy pile! That's where a super helpful skill called grouping data into categories comes in!
What is Data? (It's Just Information!)
First things first, let's talk about data. Don't let that fancy word scare you! Data is simply information or facts. Think about it: when you tell someone your favorite color, that's a piece of data. When you count how many apples are in a basket, the number you get is data. When you list all the animals you saw at the zoo, that list is data! Data is everywhere around us, all the time.
Analogy 1: Your Toy Box
Imagine your toy box. If all your LEGOs, action figures, board games, and stuffed animals are jumbled together, that's a lot of data! Each toy is a piece of information. Trying to find a specific LEGO piece in that mess would be super hard, wouldn't it?
Why Do We Group Data? (To Make Things Neat and Tidy!)
Just like you wouldn't keep your shoes in the same drawer as your cereal, we don't usually leave all our information in one big, confusing pile. We group things to make them organized. When we group data, it means we put pieces of information that are alike together. This makes it much, much easier to understand, find, and use the information.
Analogy 2: Sorting Your Laundry
Think about laundry day. Do you just throw all your clothes—shirts, pants, socks, underwear—into one giant pile in your closet? Probably not! You might put your shirts on hangers, your pants in a drawer, and your socks in a separate basket. You're grouping your clothes! You put all the shirts together because they are alike. You put all the socks together because they are alike. This makes it super easy to find what you need when you're getting dressed.
What are Categories? (The Names of Your Groups!)
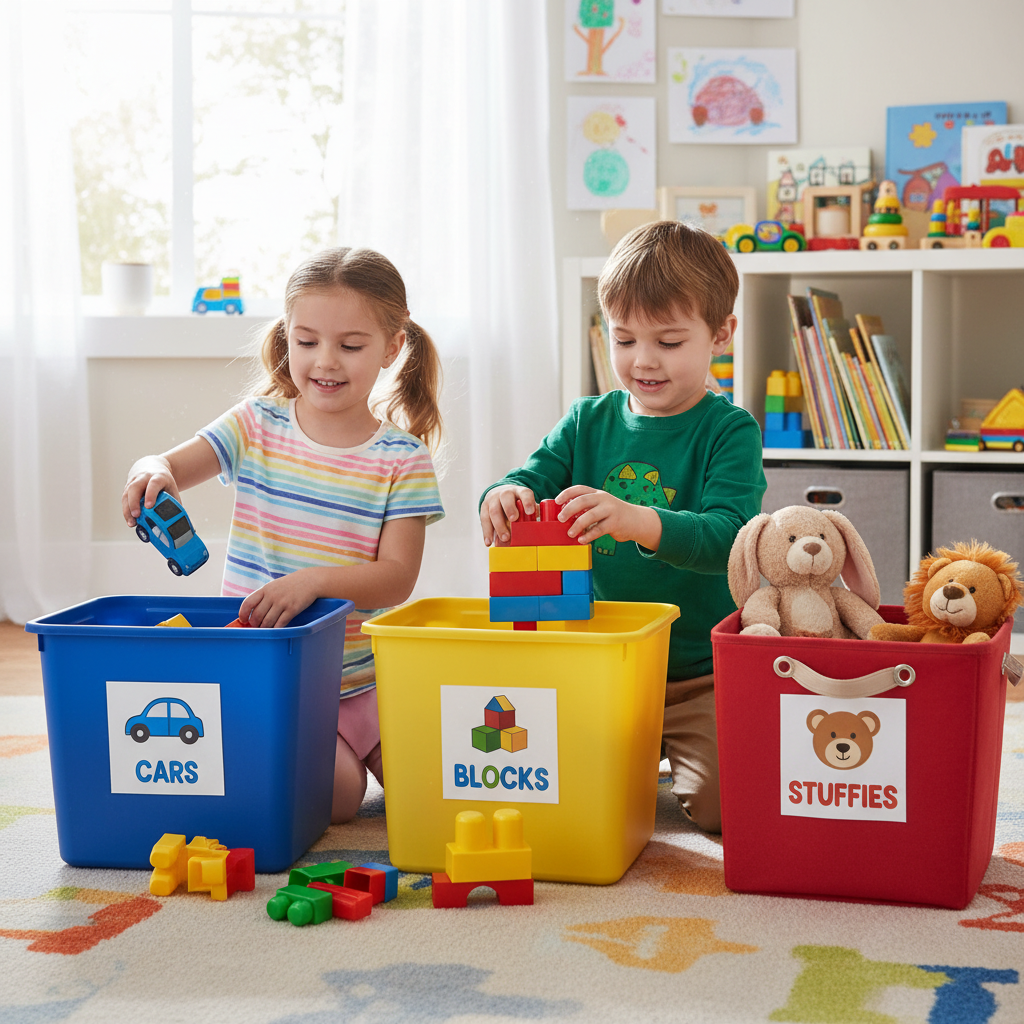
When you group things, you give a name to each group. These names are called categories. A category is like a special label or a sign that tells you what kind of things are inside that group.
- When you sort your laundry, 'Shirts,' 'Pants,' and 'Socks' are your categories.
- When you sort your toys, 'LEGOs,' 'Action Figures,' and 'Stuffed Animals' could be your categories.
The trick to making good categories is to make sure that everything in one group really belongs together because it shares something in common. It's like finding a family of items!
How Do We Choose Categories? (Look for Similarities!)
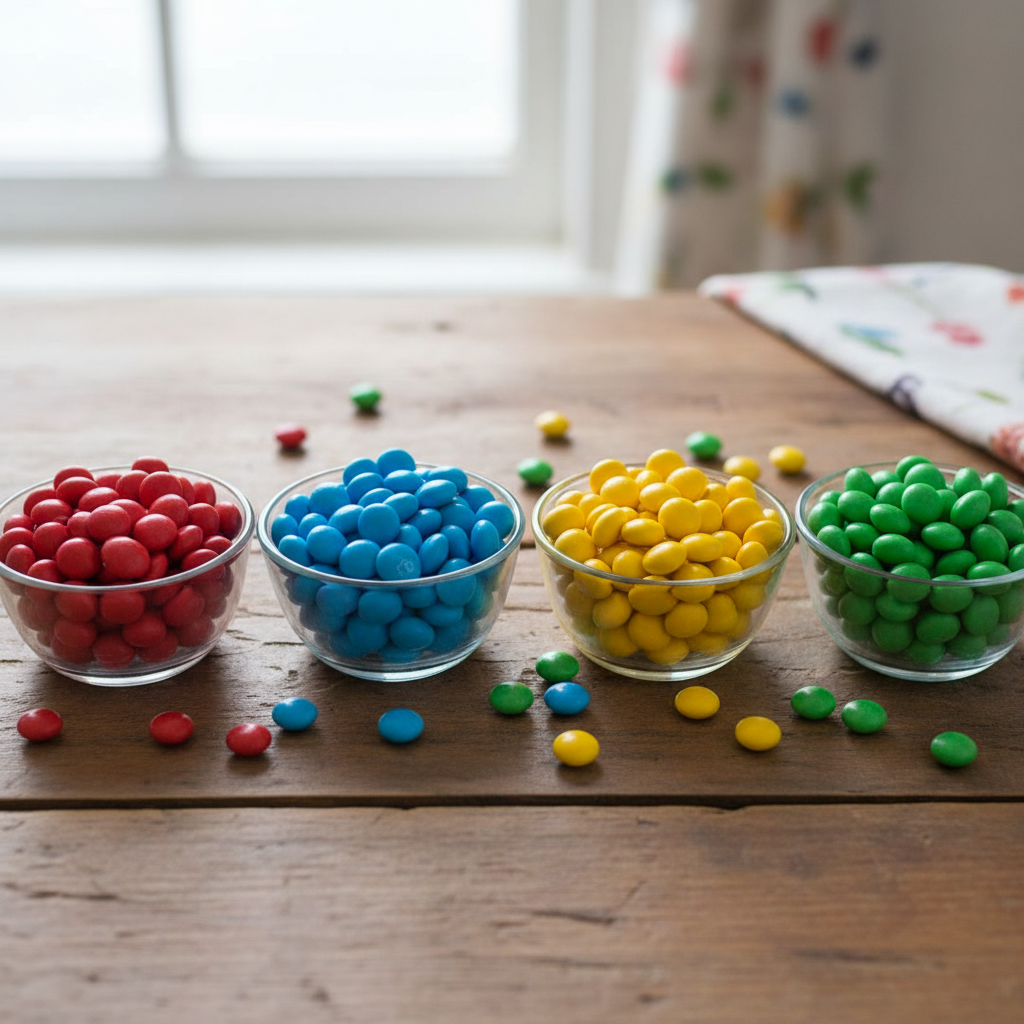
Choosing categories is all about looking for what different pieces of data have in common. You decide what rule you want to use for grouping.
Let's say you have a basket full of different fruits: apples, bananas, oranges, and grapes.
- Option A: Group by Color
You could make categories like 'Red Fruits' (apples), 'Yellow Fruits' (bananas), and 'Orange Fruits' (oranges). But what about grapes? They could be green or purple! This might get a little tricky. - Option B: Group by Type of Fruit
You could make categories like 'Apples,' 'Bananas,' 'Oranges,' and 'Grapes.' This works perfectly because each fruit is its own type!
See how you can group the same data in different ways? The best way to group depends on what information you want to understand.
Analogy 3: Sorting Your School Supplies
Imagine all your school supplies are in a big pile: pencils, markers (red, blue, green), erasers, rulers, and crayons (red, blue, green). How could you group them?
- Grouping by Type of Supply:
Categories: 'Pencils', 'Markers', 'Erasers', 'Rulers', 'Crayons'. This makes it easy to grab all your markers when you need them. - Grouping by Color (if appropriate):
Categories: 'Red Supplies' (red marker, red crayon), 'Blue Supplies' (blue marker, blue crayon), 'Green Supplies' (green marker, green crayon). This helps if you're looking for all your green art tools.
Notice that 'Pencils', 'Erasers', and 'Rulers' don't really fit into the color categories because they might not have a strong color association or you might have only one of each. So, grouping by type might be better for all school supplies.
Let's Practice with Real-World Data!
Imagine your teacher asks everyone in your class what their favorite animal is. Here's some of the data she collected:
Dog, Cat, Dog, Bird, Fish, Cat, Dog, Snake, Bird, Dog, Fish
That's a lot of animals! How can we group this data?
We can create categories for each unique animal type:
- Dogs: Dog, Dog, Dog, Dog (4 students)
- Cats: Cat, Cat (2 students)
- Birds: Bird, Bird (2 students)
- Fish: Fish, Fish (2 students)
- Snakes: Snake (1 student)
Now, isn't that much easier to understand? We can quickly see that 'Dog' is the most popular favorite animal, and 'Snake' is the least popular among these choices. Grouping data helps us to quickly learn things and make smart decisions!
 ⚠️ This picture may have spelling mistakes. Trust the words in the lesson.
The Big Idea: Making Sense of Information
Grouping data into categories is a powerful tool. It takes a big, messy collection of information and turns it into something neat, tidy, and easy to understand. Whether you're sorting your toys, your clothes, or information about your classmates' favorite things, learning to group helps you organize your world and make sense of all the amazing data around you!
Keep practicing, and soon you'll be a master at making sense of any pile of information!
Keep learning, free
Create a free Syllabax account to unlock practice questions and games for this topic.
Visual Learning Enhanced! 🚀
To help you master this topic, we use Advanced Syllabax AI to generate detailed diagrams and visual models.
Note on Visuals: The AI sometimes makes spelling errors in image labels. Please refer to the lesson text for the correct terminology.