Building Bar Graphs
Watch this topic in 60 seconds
Free preview · Lesson 1
Understanding Building Bar Graphs
Let's Build Bar Graphs! A Fun Way to Compare Things!
Hello, young mathematicians! Today, we're going to learn about something super cool called a Bar Graph. Imagine you have a bunch of your favorite toys, like teddy bears, race cars, and building blocks. How can you easily show your friend which toy you have the most of, or which one you have the least of, without counting them out loud every single time?
That's where bar graphs come in! Think of a bar graph like a special kind of picture story. Instead of words, it uses colorful blocks, or "bars," to show us how much of something we have. It's like building tall towers with your blocks, where each tower tells us something important!
What is a Bar Graph?
A bar graph is a clever drawing that uses long, colorful rectangles (we call them "bars") to show us how many of different things there are. It helps us compare things very quickly with our eyes! It's much easier to see which bar is tallest or shortest than to count lists of numbers.
Why Do We Use Bar Graphs? (It's Like a Super Helper!)
- To Compare Things Easily: Imagine you have 5 red apples and 3 green apples. A bar graph would instantly show you that the "red apple" bar is taller than the "green apple" bar. You can see who has more without even counting! It’s like lining up two friends and instantly seeing who is taller.
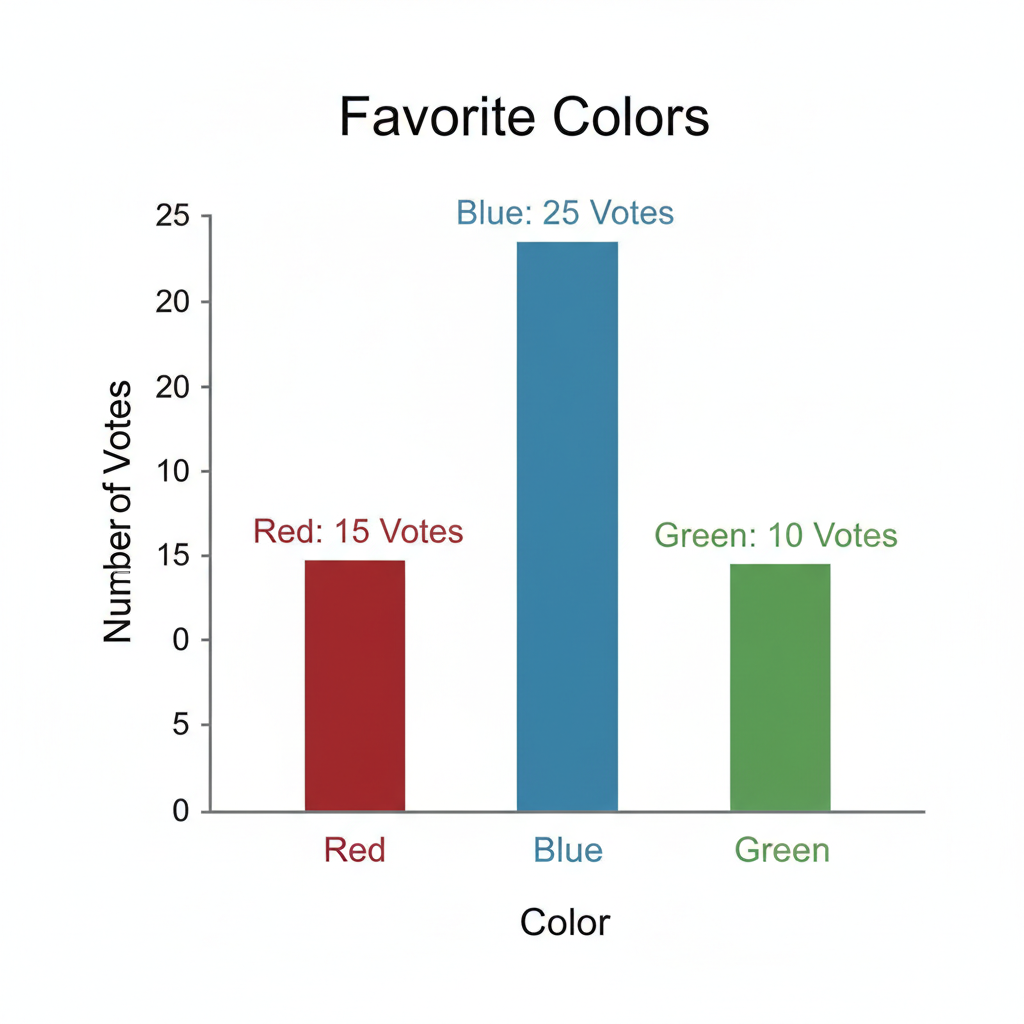
- To Understand Information Quickly: Maybe your teacher wants to know what everyone's favorite color is. Instead of reading a long list, a bar graph can show the most popular color with the tallest bar in a blink!
The Building Blocks of a Bar Graph (Parts of Our Picture Story!)
Just like a good story has characters and a setting, a bar graph has special parts that help us understand it. Let's meet them!
1. The Title: What's Our Story About?
Every bar graph needs a Title. The title tells us what the whole graph is about. It's like the name of your favorite book or movie. For example, if your graph is about favorite fruits, the title might be "Our Class's Favorite Fruits."
2. Labels: Naming Our Towers!
Along the bottom of the graph, you'll see Labels. These labels tell us what each bar stands for. If you're counting different types of toys, the labels might be "Teddy Bears," "Race Cars," and "Building Blocks." Each label is like a name tag for your different groups of things.
3. Numbers/Scale: How Tall Are Our Towers?
Along the side of the graph, going up, you'll see Numbers. These numbers tell us "how many" of each thing there are. It's like a ruler that measures how tall each of your block towers is. If a bar goes up to the number 5, it means there are 5 of that thing.
Sometimes, these numbers go up by 1s (1, 2, 3, 4, 5...) which is perfect for Grade 1!
4. The Bars: Our Colorful Towers!
And finally, the most colorful part! The Bars themselves are the rectangles that shoot up from the labels. Each bar shows how many of something there is by how tall it is. A very tall bar means lots of that thing, and a short bar means just a few. Think of them as buildings in a tiny city, where the height of each building tells you something about it!
How to Build Your Own Bar Graph (Let's Play Architect!)
Building a bar graph is like being an architect for your data city! Let's build one together. Imagine we asked all your friends what their favorite pet is. Here's what we found:
- Dogs: 6 friends
- Cats: 4 friends
- Fish: 2 friends
Now, let's turn this into a super cool bar graph!
Step 1: Gather Your Information (Count Your Treasure!)
First, you need to know what you're counting and how many of each. We already did this! We have Dogs (6), Cats (4), and Fish (2). This is our "data."
Step 2: Draw Your "L" Shape (The Foundation!)
Take a piece of paper. Draw a line straight across the bottom (this is called the "x-axis") and a line straight up from the left side (this is called the "y-axis"). It looks like a giant "L" or the corner of a room!
Step 3: Label the Bottom (What are we counting?)
Below the bottom line, write the names of the things you counted. For our example, we'll write "Dogs," "Cats," and "Fish" with some space between them.
Step 4: Label the Side (How many?)
Along the line going up, write your numbers starting from 0 at the very bottom corner. We need to go high enough for our biggest number, which is 6 (for dogs). So, we'll write 0, 1, 2, 3, 4, 5, 6, with each number getting its own spot higher up.
Step 5: Draw Your Bars (Build Those Towers!)
- For Dogs: Find "Dogs" on the bottom. Now, look at the numbers on the side. Draw a colorful bar straight up from "Dogs" until it reaches the line next to the number 6. Color it in!
- For Cats: Do the same for "Cats." Draw a bar up until it reaches the line next to the number 4. Color it in!
- For Fish: And for "Fish," draw a bar up to the number 2. Color it in!
Step 6: Give Your Graph a Title (Name Your Masterpiece!)
At the very top of your paper, write a clear title. For our example, "Our Class's Favorite Pets" would be perfect!
You Did It!
Now you have a wonderful bar graph! You can instantly see that dogs are the most favorite pet because their bar is the tallest. Fish are the least favorite because their bar is the shortest. Cats are in the middle!
Bar graphs are fantastic tools for showing information in a clear, colorful, and fun way. Keep practicing, and you'll be a bar graph expert in no time!
Keep learning, free
Create a free Syllabax account to unlock practice questions and games for this topic.
Visual Learning Enhanced! 🚀
To help you master this topic, we use Advanced Syllabax AI to generate detailed diagrams and visual models.
Note on Visuals: The AI sometimes makes spelling errors in image labels. Please refer to the lesson text for the correct terminology.