Learning Journey
Free preview · Lesson 1
Understanding Using Data to Answer Questions
Becoming Data Detectives: Using Information to Solve Mysteries!
Have you ever wondered what your classmates' favorite colors are? Or which game is most popular at recess? Or even how many sunny days we had last month? To find answers to these kinds of questions, we need to become data detectives!
What is Data? (Our Clues!)
Imagine you're baking a delicious cake. You need flour, sugar, eggs, and milk, right? These are your ingredients. In a similar way, data are like the ingredients or clues we collect to understand something. Data is simply information or facts, often in the form of numbers, words, or observations, that we gather to help us learn about the world around us.
Think of it this way: If you want to know what kind of pet your friends have, 'dog,' 'cat,' 'fish,' or 'hamster' are all pieces of data. If you count how many friends have a dog, the number '5' is also a piece of data.
Why Do We Use Data? (To Solve the Mystery!)
Why do detectives collect clues? To solve a mystery! We use data for the same reason – to answer questions and understand things better. Data helps us:
- Make choices: Like choosing the best game for the class party.
- Learn new things: Discovering what most people like or dislike.
- Understand patterns: Seeing if something happens more often than something else.
Using data is like having a superpower that lets you peek into the world and find out how things really are!
Collecting Data: Gathering Our Clues!
Before we can answer questions, we need to gather our data. There are many ways to do this, just like there are many ways to find clues:
- Asking Questions (Surveys): This is like interviewing witnesses! You can ask people directly. For example, 'What is your favorite fruit?' or 'How do you get to school?' When you ask many people the same question, you are doing a survey.
- Observing (Watching): Sometimes you just watch and count. For instance, you could watch a bird feeder for an hour and count how many different types of birds visit. You're not asking them questions, just seeing what happens!
- Experimenting (Trying it Out): This is when you try something new and record what happens. Maybe you want to see which type of paper airplane flies the furthest. You'd make a few different types, fly them, and measure the distance for each. Those measurements are your data!
No matter how you collect it, the important thing is to be careful and accurate, just like a detective makes sure their clues are correct!
Organizing Data: Making Sense of the Clues!
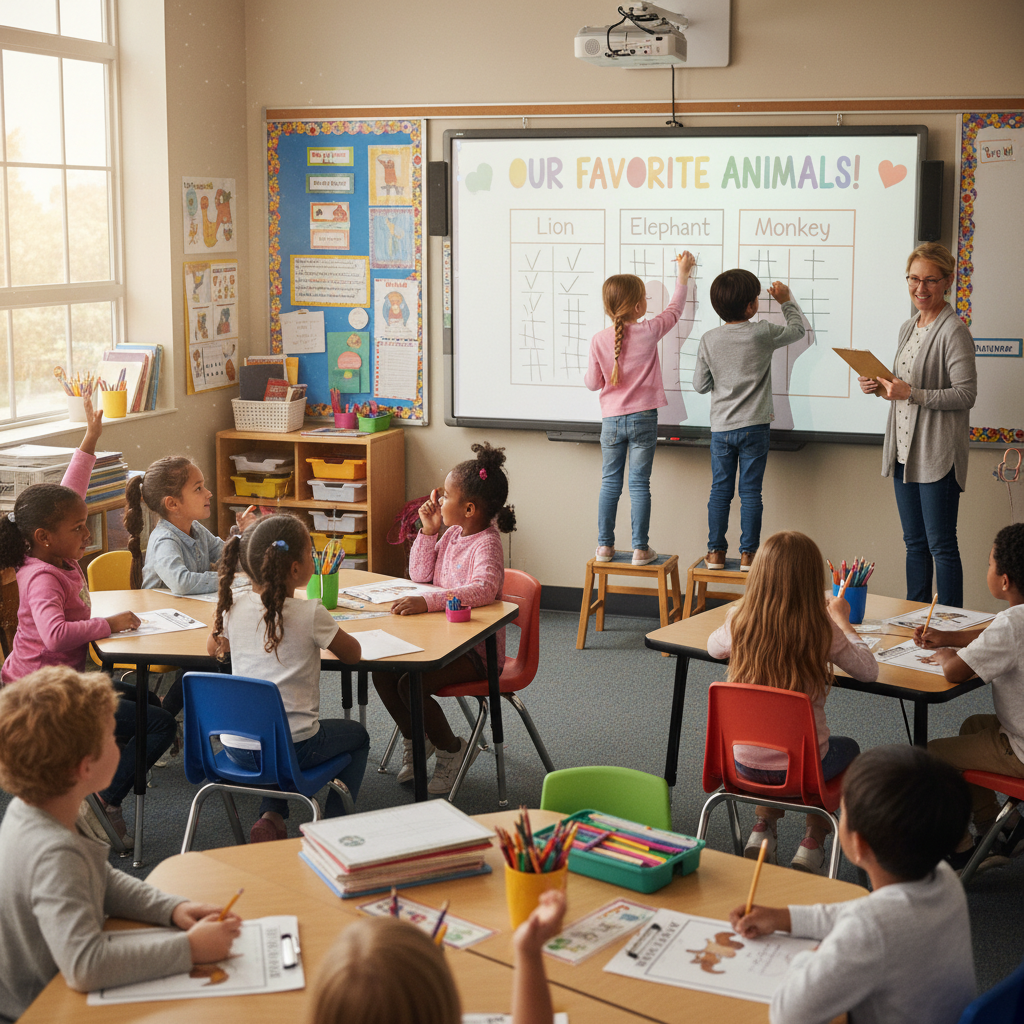
Imagine a detective with a huge pile of clues – notes, photos, fingerprints – all mixed up! It would be hard to solve anything. It's the same with data! Once we've collected data, we need to organize it so we can understand it easily. Organizing data is like sorting your LEGO bricks by color or size so you can find what you need quickly.
Common Ways to Organize Data:
-
Tally Marks: These are super simple lines that help you count. Every time something happens, you draw a line. When you get to four lines, the fifth one crosses them diagonally (
||||becomes||||). This makes counting groups of five much easier! - Tables: A table is like a neat box with rows and columns. You can put your data into categories and numbers, making it very clear to read.
- Pictographs: A pictograph uses pictures or symbols to represent data. Each picture might stand for one item, or sometimes, one picture can stand for more than one item (like one smiley face equals two students). It's a fun, visual way to show information!
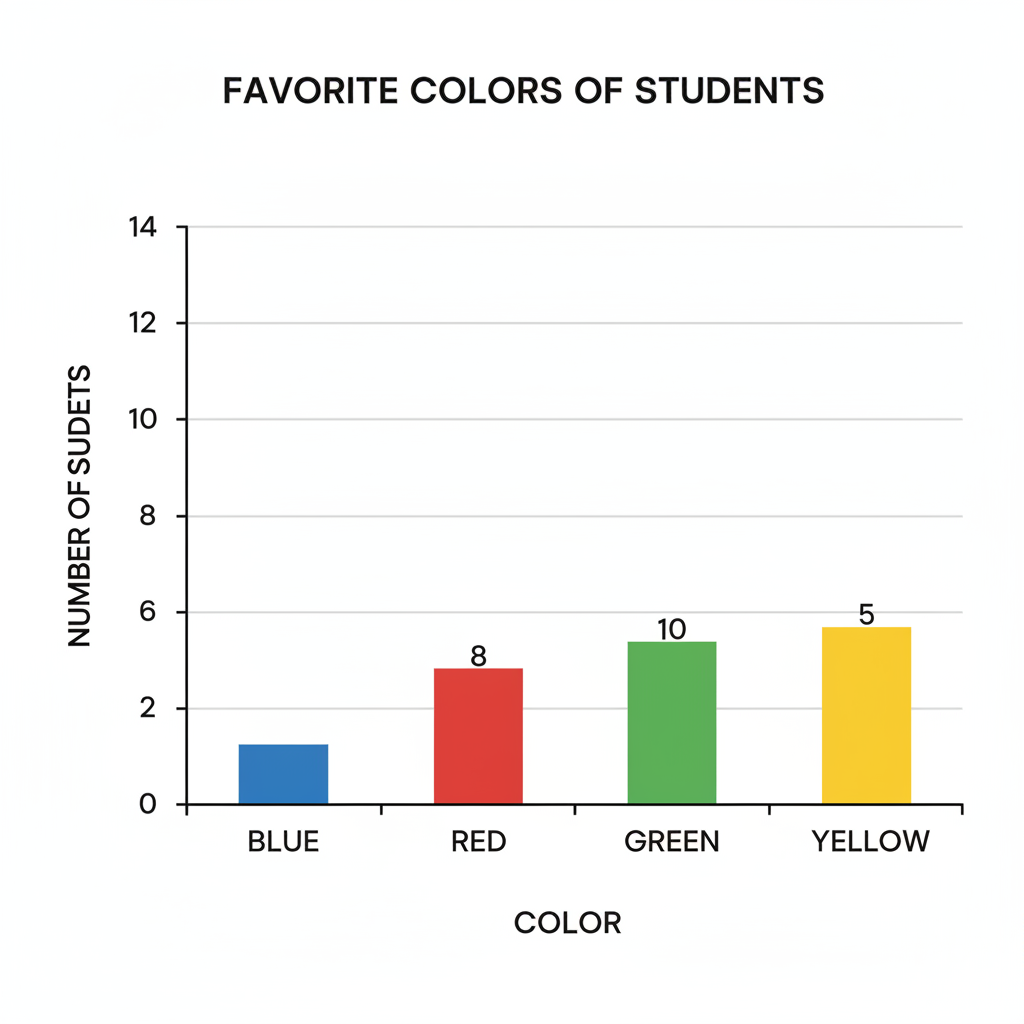
- Bar Graphs: A bar graph uses bars (rectangles) of different lengths or heights to show amounts. The longer the bar, the more of that item there is. Bar graphs are great for comparing different categories side-by-side. Think of them like towers – the taller the tower, the more it represents!
Reading and Understanding Data: What Do the Clues Tell Us?
Once your data is organized, usually in a graph or table, it's time to read it! This is where you look closely at all the details:
- Look at the Title: What is the graph or table about?
- Check the Labels: What do the different parts (like the names of the bars or rows) mean?
- Read the Key (for pictographs): If there's a key, it tells you what each picture or symbol stands for.
- Count and Compare: Look at the numbers or lengths of the bars. Which is the biggest? Which is the smallest? Are any the same?
Reading data carefully helps you avoid making mistakes, just like a detective carefully examines every clue.
 ⚠️ This picture may have spelling mistakes. Trust the words in the lesson.
Answering Questions with Data: Solving the Mystery!
Now for the most exciting part – using your organized data to answer the questions you started with! This is when all your hard work collecting and organizing pays off.
For example, if you collected data on favorite fruits and made a bar graph:
- Question: Which fruit is the most popular?
Answer: Look for the tallest bar on your graph. That's your most popular fruit! - Question: How many more students like apples than bananas?
Answer: Find the bar for apples and bananas. Count how many 'units' or how much longer the apple bar is than the banana bar. - Question: How many students were surveyed in total?
Answer: Add up the numbers from all the different bars (or categories) in your graph.
When you answer questions using data, you're not just guessing; you're using real facts and information you gathered yourself! You've become a true data detective, solving the mystery with evidence!
Keep Practicing Your Data Detective Skills!
The world is full of questions, and data is all around us, waiting to be collected, organized, and used to find answers. Keep practicing your data detective skills, and you'll be amazed at what you can discover!
Keep learning, free
Create a free Syllabax account to unlock practice questions and games for this topic.
Visual Learning Enhanced! 🚀
To help you master this topic, we use Advanced Syllabax AI to generate detailed diagrams and visual models.
Note on Visuals: The AI sometimes makes spelling errors in image labels. Please refer to the lesson text for the correct terminology.