Comparing Picture Graph Data
Watch this topic in 60 seconds
Free preview · Lesson 1
Understanding Comparing Picture Graph Data
Comparing Picture Graph Data: Let's Find Out Who Has More!
Hello, young mathematicians! Have you ever seen a drawing that shows how many of something there are? Maybe it was a picture of stars to show how many kids like to play outside, or pictures of yummy apples to show how many people ate fruit. Well, those are very much like a special kind of chart called a Picture Graph!
What is a Picture Graph?
Imagine you have a big basket of your favorite toys – maybe some shiny cars, some soft teddy bears, and some colorful building blocks. If you wanted to show your friend exactly how many of each toy you have, you could draw a little picture for each one. That's almost exactly what a picture graph does!
A picture graph uses pictures or symbols to show us how much of something we have. Each picture usually stands for one item. It’s like a super clear, visual way of counting! Think of it like a special display wall in your classroom. Each section of the wall is for a different thing, and for every item you count (like every student who likes apples), you put up one picture of that item (one apple picture). If 3 students like apples, you see 3 apple pictures.
It's like having different parking spots for different kinds of vehicles. If you have a spot for bicycles, and you park 4 little bicycle pictures there, everyone knows there are 4 bicycles! Picture graphs help us quickly see quantities without having to read a lot of words.
How Do We Read a Picture Graph?
Reading a picture graph is super easy and fun! All you have to do is count the pictures for each category. Think of it like scanning a shelf to see how many books of one type are there.
- First, look at the title of the graph. It’s like the name of the story the graph is telling you. It tells you what the graph is all about (for example, "Our Favorite Animals" or "Number of Sunny Days").
- Next, look at the different categories. These are the different things being counted (like "Cats," "Dogs," "Birds," or "Monday," "Tuesday"). They are usually listed on the side or bottom of the graph.
- Then, simply count how many pictures are in each row or column for each category. That number tells you "how many" of that item there are. If there are 5 pictures of happy faces next to "Recess," it means 5 students love recess!
For example, if a picture graph shows "Favorite Pets" and has 4 little pictures of dogs, it means 4 people like dogs best! If it has 7 pictures of fish, then 7 people like fish best. Simple as counting your fingers and toes! Every picture is like one tally mark, but much more fun to look at!
Comparing Data: Who Has More? Who Has Less?
Now for the really exciting part: Comparing! Comparing means looking at two or more things and figuring out how they are different or the same. When we compare data on a picture graph, we want to know things like:
- Which category has more? (Which group of pictures is bigger, or has a longer line of pictures?)
- Which category has less? (Which group of pictures is smaller, or has a shorter line of pictures?)
- Do any categories have the same amount? (Do any groups have the exact same number of pictures, making their lines look equally long?)
Let's Compare!
Imagine you have two friends, Lily and Tom. Lily has 5 bright stickers, and Tom has 3 shiny stickers. To compare them, you can put them side-by-side. Who has more stickers? Lily! Who has less? Tom! You can see it just by looking at the two groups of stickers. On a picture graph, it’s just like that, but with the pictures.
When we look at a picture graph, we do the same thing. We look at the rows or columns for two different categories and see which one has more pictures and which one has fewer pictures. It's like having a staring contest between two rows of pictures – which one stretches out further? The one that stretches further has more!
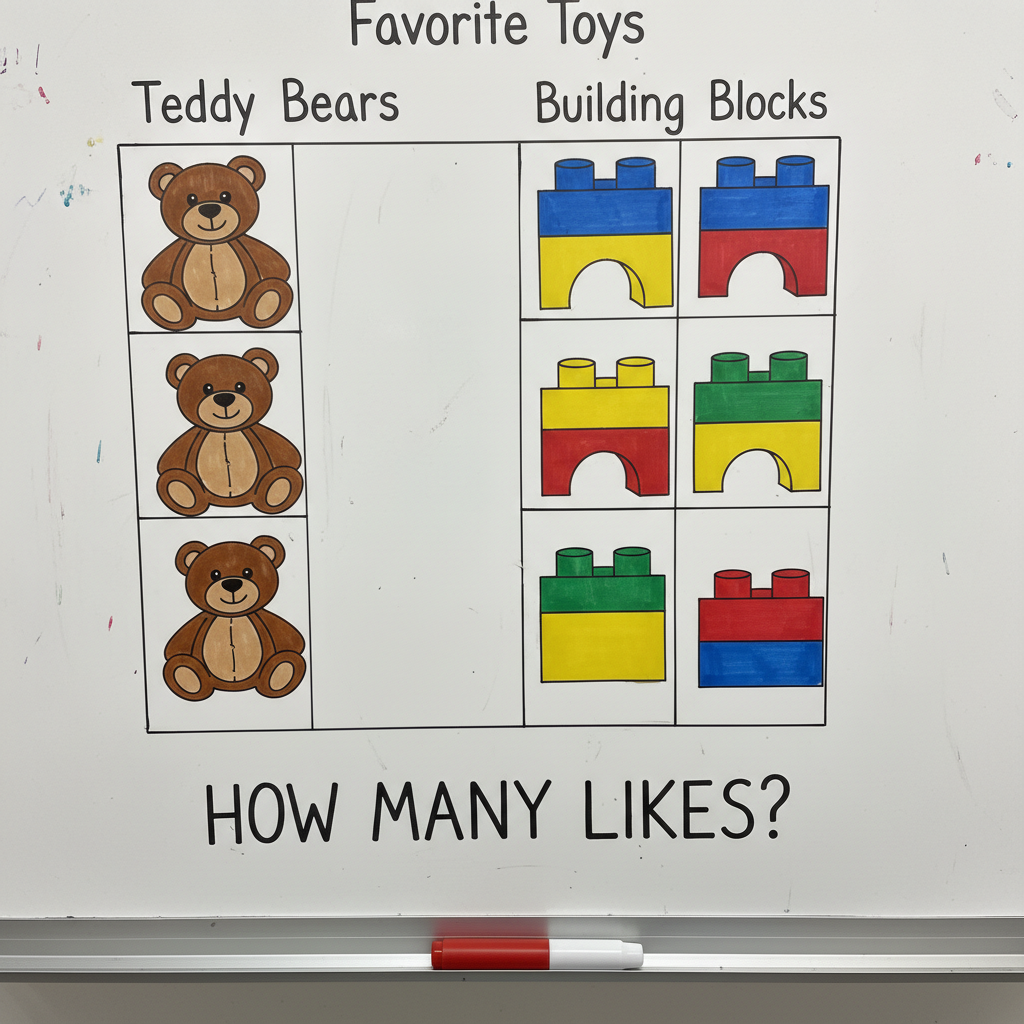
Let's use an example. Say our graph shows:
- Apples: (4 apples)
- Bananas: (2 bananas)
If we compare apples and bananas:
- Apples have 4 pictures.
- Bananas have 2 pictures.
Since 4 is a bigger number than 2, we can say that more people like apples than bananas! And since 2 is a smaller number than 4, we can say that fewer people like bananas than apples! See how easy that is? You're just looking to see which group has a bigger number of pictures.
How Many More? How Many Less? Finding the Difference!
Sometimes, we want to know not just who has more, but exactly how many more! This is like finding the "difference" between two numbers. It tells us the exact gap between the two amounts.
Let's go back to Lily with 5 stickers and Tom with 3 stickers. To find out how many more stickers Lily has than Tom, we can do a little trick:
- Match them up! Imagine pairing up one of Lily's stickers with one of Tom's stickers. You can do this 3 times because Tom has 3 stickers.
- What's left over? Lily still has 2 stickers left that don't have a partner from Tom's pile!
So, Lily has 2 more stickers than Tom. This is the same as doing a subtraction problem: 5 - 3 = 2. The number 2 is the difference! It tells us the exact amount more.
On a picture graph, you do the same thing! Count the pictures for the bigger group, count the pictures for the smaller group, and then subtract the smaller number from the bigger number. The answer tells you "how many more" or "how many less."
Using our apples and bananas example:
- Apples: 4
- Bananas: 2
How many more apples than bananas? We do 4 - 2 = 2. So, there are 2 more apples than bananas! It's like laying out the pictures next to each other and seeing how many "extra" pictures one group has sticking out. Those extra pictures are the difference!
You can also think of it like jumping on a number line. Start at the smaller number (2 for bananas) and count up to the larger number (4 for apples). How many jumps did you make? 1 jump to 3, then 1 jump to 4. That's 2 jumps! So, 2 more.
Key Things to Remember!
You are now a picture graph comparing expert! Keep practicing, and you'll be amazing!
Keep learning, free
Create a free Syllabax account to unlock practice questions and games for this topic.
Visual Learning Enhanced! 🚀
To help you master this topic, we use Advanced Syllabax AI to generate detailed diagrams and visual models.
Note on Visuals: The AI sometimes makes spelling errors in image labels. Please refer to the lesson text for the correct terminology.