Comparing Picture Graph Data
Watch this topic in 60 seconds
Free preview · Lesson 1
Understanding Comparing Picture Graph Data
Let's Compare Picture Graph Data!
Hello, amazing Second Graders! Have you ever seen a drawing that tells you numbers and information? It's like a secret picture message! Today, we're going to learn all about Picture Graphs and how to Compare Data in them. It's going to be like being a super detective, finding clues in pictures!
What is a Picture Graph? (Like a Picture Story!)
Imagine you have a bunch of your favorite toys. Instead of just writing down 'I have 5 cars, 3 balls, and 2 teddy bears,' what if you drew a car for every car you have, a ball for every ball, and a teddy bear for every teddy bear? That's almost exactly what a picture graph is!
- A Picture Graph uses little drawings or symbols to show how many of something there are. It's like a story told with pictures instead of just words or numbers.
- Think of it like a sticker chart! If you get a sticker for every time you read a book, the number of stickers tells you how many books you read. A picture graph works the same way!
The Super Important 'Key'! (Your Secret Decoder Ring!)
Every good picture graph has a very, very important part called the Key. The key is like a secret decoder ring, or the legend on a treasure map! It tells you what each picture stands for.
- Sometimes, one picture might mean '1' thing. So, if you see 3 apple drawings, it means 3 apples.
- But sometimes, one picture might mean '2' things, or even '5' things! If the key says 'One apple drawing = 2 apples,' and you see 3 apple drawings, how many apples do you have? You'd count by twos: 2, 4, 6! So you have 6 apples!
- Always, always, ALWAYS look at the key first! It's the first clue you need to solve the picture graph mystery.
Reading a Picture Graph (Counting Our Picture Story!)
Once you know about the key, reading a picture graph is just like counting! Let's say we have a picture graph about favorite fruits:
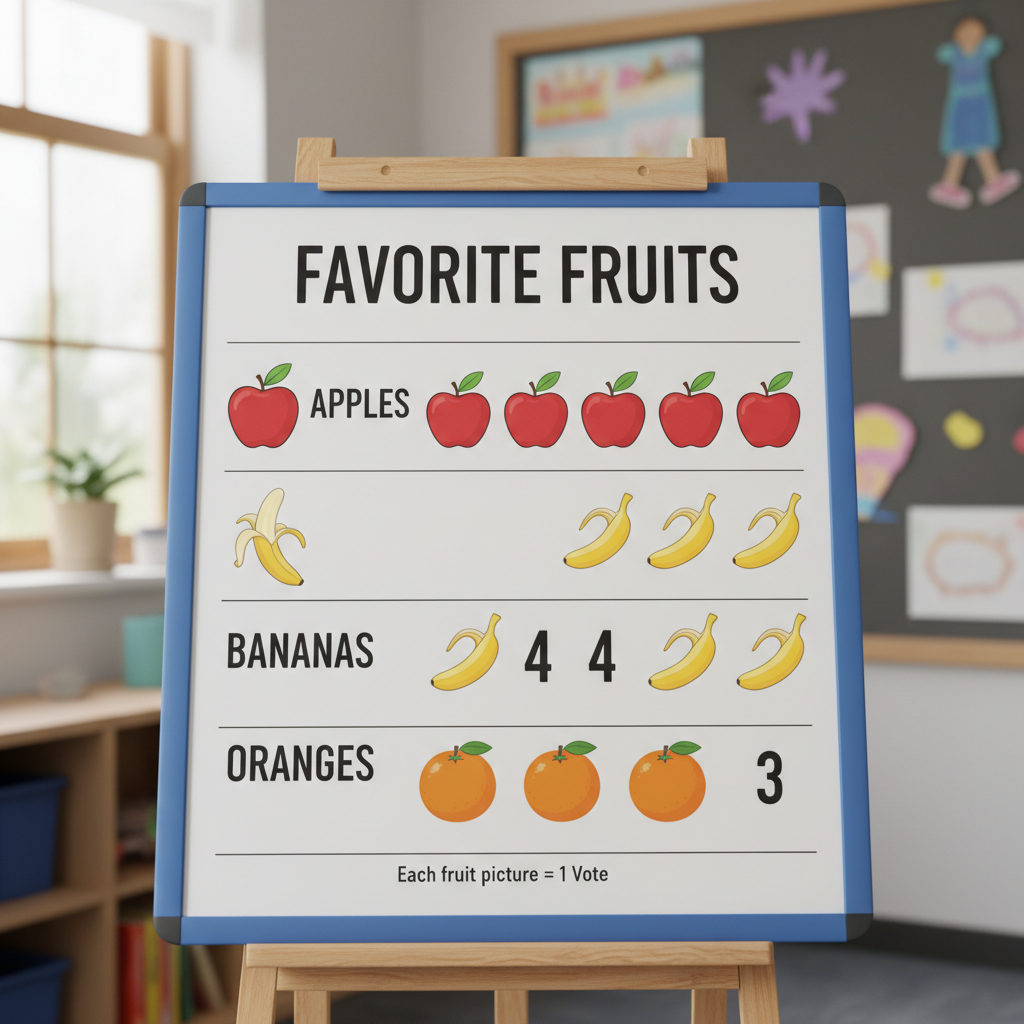 ⚠️ This picture may have spelling mistakes. Trust the words in the lesson.
Imagine this graph shows:
- Apples: 🍎 🍎 🍎 🍎 🍎 (5 apples)
- Bananas: 🍌 🍌 🍌 (3 bananas)
- Oranges: 🍊 🍊 🍊 🍊 (4 oranges)
And the key says: 'Each fruit picture = 1 person'.
To read it, you just count the pictures for each item. So, 5 people like apples, 3 people like bananas, and 4 people like oranges.
Comparing Data! (Who Has More? Who Has Less? Are They the Same?)
Now for the super fun part: Comparing Data! Comparing is when you look at two or more things and see how they are alike or different. In picture graphs, it means looking at two groups of pictures and figuring out which group has:
- More: A bigger number, like having more cookies than your friend.
- Less/Fewer: A smaller number, like having fewer toys than someone else.
- The Same: Equal numbers, like if you and your friend both have 5 candies.
How to Compare Data Step-by-Step (Your Comparison Superpower!)
Let's use our favorite fruits graph again to learn how to compare:
Question 1: Do more people like Apples or Bananas?
- Find the two things: Apples and Bananas.
- Count for each: Apples = 5, Bananas = 3.
- Compare the numbers: Is 5 more than 3, or less than 3? 5 is MORE than 3!
- Answer: More people like Apples than Bananas.
Question 2: Which fruit do fewer people like: Oranges or Bananas?
- Find the two things: Oranges and Bananas.
- Count for each: Oranges = 4, Bananas = 3.
- Compare the numbers: Is 4 more than 3, or is 3 less than 4? 3 is LESS than 4!
- Answer: Fewer people like Bananas than Oranges.
Question 3: How many MORE people like Apples than Oranges?
- Find the two things: Apples and Oranges.
- Count for each: Apples = 5, Oranges = 4.
- Compare and Subtract: To find 'how many more,' you take the bigger number and subtract the smaller number. 5 - 4 = 1.
- Answer: 1 more person likes Apples than Oranges.
Another Example: Classroom Pets!
Let's try another one with a different key! Imagine a graph about favorite classroom pets:
Imagine this graph shows:
- Fish: 🐠 🐠 🐠 (3 fish pictures)
- Hamsters: 🐹 🐹 🐹 🐹 (4 hamster pictures)
- Birds: 🐦 🐦 (2 bird pictures)
And the key says: 'Each pet picture = 2 pets'. Uh oh, the key changed! Remember our secret decoder ring? We need to count by twos!
- Fish: 3 pictures x 2 pets/picture = 6 pets
- Hamsters: 4 pictures x 2 pets/picture = 8 pets
- Birds: 2 pictures x 2 pets/picture = 4 pets
Now, let's compare:
Question: Which pet do more students like, Fish or Hamsters?
- Find the two things: Fish and Hamsters.
- Count for each (using the key!): Fish = 6, Hamsters = 8.
- Compare the numbers: 8 is MORE than 6!
- Answer: More students like Hamsters than Fish.
Question: How many FEWER students like Birds than Fish?
- Find the two things: Birds and Fish.
- Count for each (using the key!): Birds = 4, Fish = 6.
- Compare and Subtract: 6 - 4 = 2.
- Answer: 2 fewer students like Birds than Fish.
Why is Comparing Data Important? (Making Smart Choices!)
Why do we learn to compare picture graph data? It helps us understand the world around us! It helps us make smart choices:
- If a class is deciding which game to play, and a picture graph shows more kids like 'Tag' than 'Hide-and-Seek,' they might choose Tag!
- If a store sees a picture graph showing more people buy red apples than green apples, they'll know to order more red apples!
You are now a data comparison expert! Keep practicing, and you'll be able to read and compare any picture graph like a pro!
Keep learning, free
Create a free Syllabax account to unlock practice questions and games for this topic.
Visual Learning Enhanced! 🚀
To help you master this topic, we use Advanced Syllabax AI to generate detailed diagrams and visual models.
Note on Visuals: The AI sometimes makes spelling errors in image labels. Please refer to the lesson text for the correct terminology.