Understanding Simple Charts
Watch this topic in 60 seconds
Free preview · Lesson 1
Understanding Understanding Simple Charts
Understanding Simple Charts: Your Visual Storybook for Numbers!
Hey there, young data detectives! Have you ever seen a picture that tells you a whole story without using many words? That's exactly what simple charts do, but their stories are all about numbers and information! Imagine trying to tell your friend how many different colored candies you have. You could say, "I have 5 red, 3 blue, and 2 yellow." Or, you could draw a quick picture, and they'd get it instantly! Charts are like those helpful pictures.
What is a Chart?
Think of a chart as a special kind of drawing that helps us see and understand information (we call this 'data') super fast. Instead of reading long lists of numbers, a chart turns those numbers into shapes, lines, or pictures that are easy to compare. It's like a secret code for numbers that, once you learn it, makes everything clear!
Why Do We Use Charts? (They're Super Powers for Numbers!)
Charts have some amazing superpowers:
- Quick Looks: They let us see who has the most or the least of something in a blink.
- Easy Comparisons: It's much simpler to compare two things when they're side-by-side in a picture.
- Understanding Big Ideas: Even lots of numbers can make sense when they're put into a chart.
The Important Parts of Every Chart (Like Ingredients in a Recipe!)
Just like a delicious cake needs flour, sugar, and eggs, every chart needs a few important parts to make sense:
-
The Title: What's This Story About?
Every good book has a title, right? A chart does too! The title tells you exactly what information the chart is showing. It's usually at the very top. For example, a title might be "Favorite Fruits of Class 4A" or "Number of Books Read This Month."
-
Labels: Naming Everything!
Imagine going to a party where nobody has a name tag! It would be confusing. Charts have labels that tell you what each part of the chart represents. If you have bars on your chart, the labels might tell you if a bar represents "Apples" or "Oranges." If you have numbers going up the side, a label will tell you what those numbers mean, like "Number of Students" or "Hours Spent."
-
The Key or Scale: How Do We Count?
Sometimes, a chart uses pictures, and one picture might mean more than one item. This is where the key comes in! It's like a small instruction box that tells you, "One picture of a smiling face means 5 students." If a chart uses bars or lines, it has a scale, which are the numbers along the side or bottom that show you how much each bar or line is counting up to. It's like the ruler you use to measure things.
Let's Meet Two Friendly Chart Types!
1. Pictographs: Charts Made of Pictures!
A pictograph is a chart that uses little pictures or symbols to show data. It's one of the simplest and most fun charts because it's like a visual storybook! Each picture usually stands for a certain number of things.
Imagine this: Your teacher wants to know how many students prefer cats, dogs, or fish as pets. Instead of writing numbers, she draws a paw print for each pet. But maybe one paw print means 2 pets! That's when you'd look at the 'key'.
How to Read a Pictograph:
- Read the title: What is the pictograph about?
- Look at the labels: What categories are being shown (e.g., "Cats," "Dogs," "Fish")?
- Find the key: This is super important! It tells you what each picture stands for (e.g., " = 2 pets").
- Count the pictures: Multiply the number of pictures by what the key says to find the total for each category.
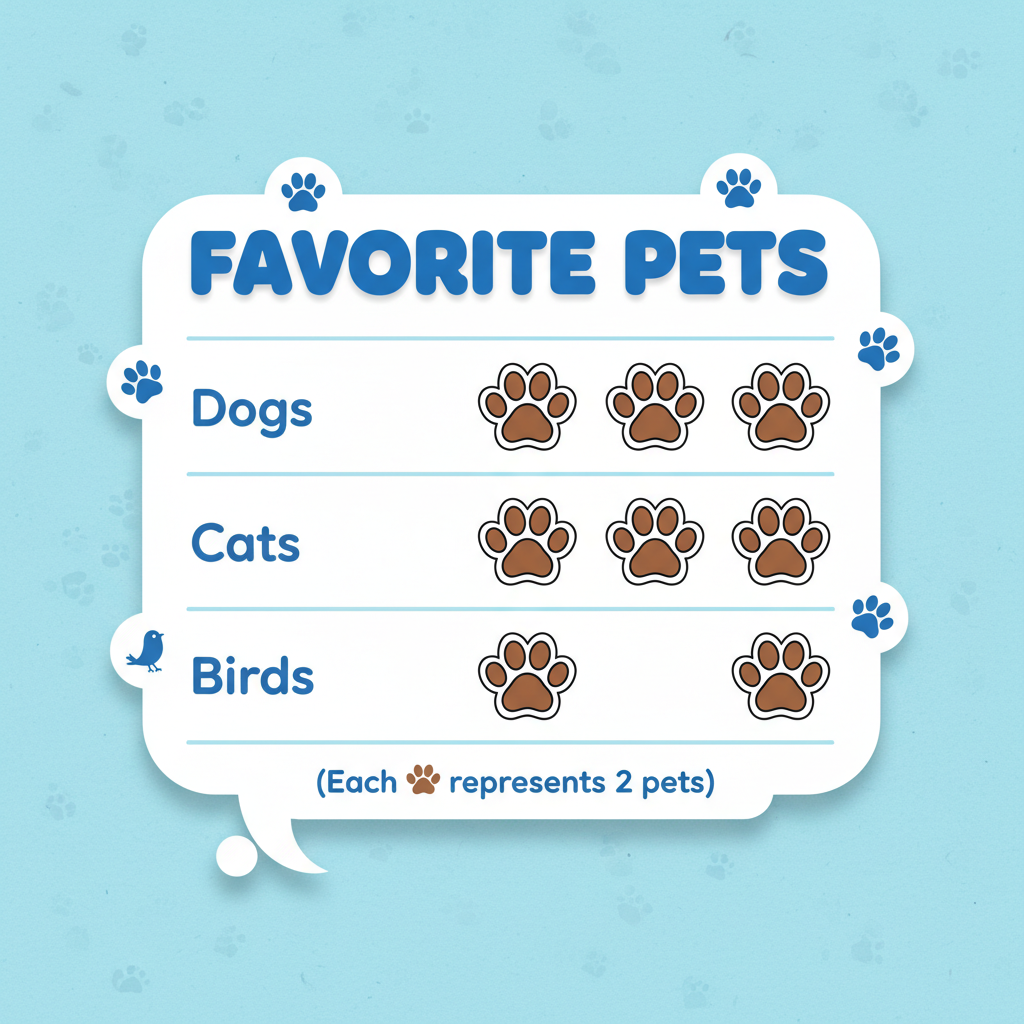
In this example, if a paw print means 2 pets:
- Dogs: 4 paw prints x 2 = 8 pets
- Cats: 3 paw prints x 2 = 6 pets
- Birds: 2 paw prints x 2 = 4 pets
2. Bar Charts: Tall Towers of Information!
A bar chart uses rectangular bars to show how much or how many of something there is. The longer or taller the bar, the greater the amount. Think of them like skyscrapers in a city, where each building's height tells you how important or big something is!
Bar charts can have bars going up and down (vertical) or sideways (horizontal). For 4th grade, we often see them going up and down.
How to Read a Bar Chart:
- Read the title: What is the bar chart about?
- Look at the labels on the bottom (categories, like "Red," "Blue") and the side (the numbers, like "Number of Votes").
- Look at the scale on the side: What do the numbers mean? Do they go up by 1s, 2s, 5s, or 10s? This is your measuring stick!
- Find the top of each bar: See which number on the scale it lines up with. That's the amount for that category.
- Compare the bars: Which bar is the tallest? Which is the shortest?
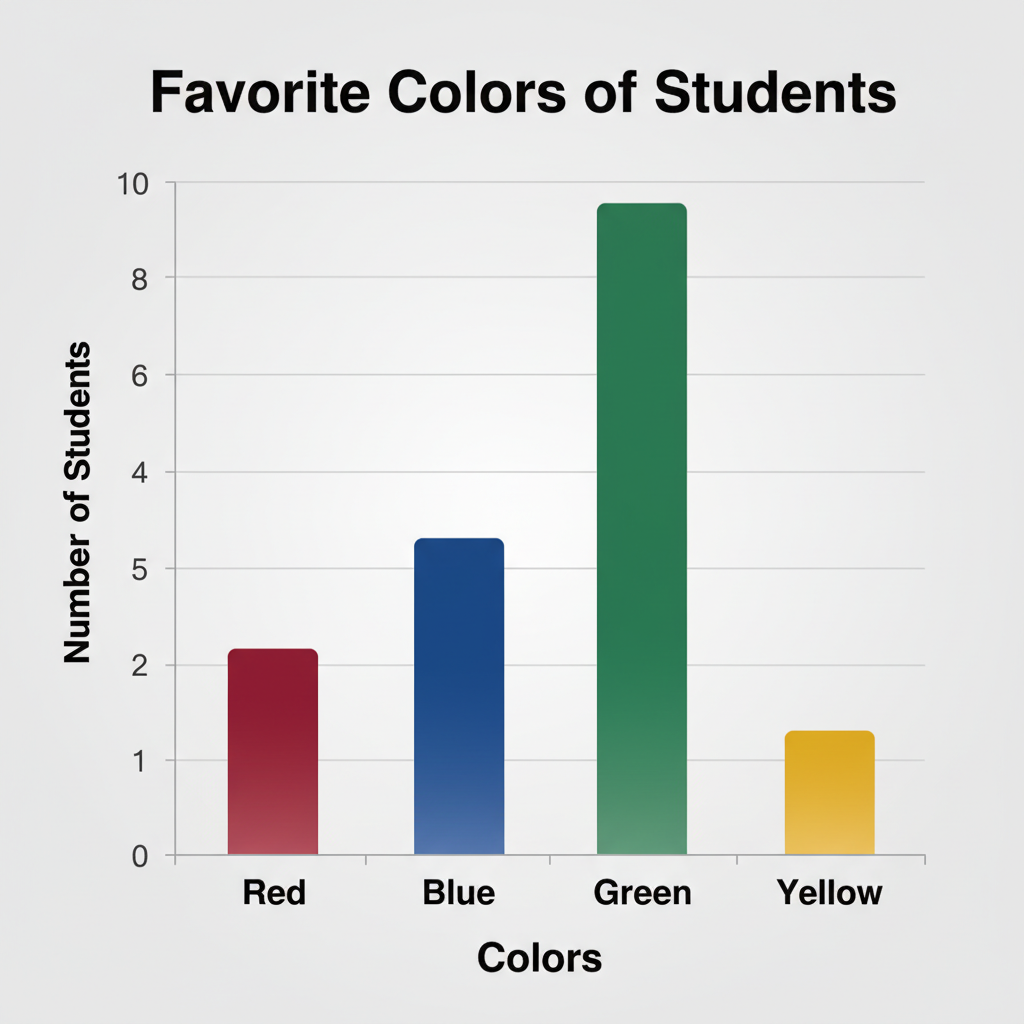
In this example:
- The title is "Favorite Colors."
- The categories (colors) are on the bottom.
- The numbers (number of students) are on the side, going up by 1s.
- The blue bar is the tallest, reaching 10, meaning 10 students like blue the most.
- The yellow bar is the shortest, reaching 3, meaning 3 students like yellow the most.
Putting It All Together: Becoming a Chart Super Reader!
No matter what kind of simple chart you see, remember these steps to understand its story:
- Always start with the title.
- Look at the labels to know what's being counted or compared.
- Check the key (for pictographs) or the scale (for bar charts) to know how to count.
- Then, you can compare and understand all the wonderful information the chart has for you!
You are now ready to be a chart super reader and unlock all the number stories around you!
Keep learning, free
Create a free Syllabax account to unlock practice questions and games for this topic.
Visual Learning Enhanced! 🚀
To help you master this topic, we use Advanced Syllabax AI to generate detailed diagrams and visual models.
Note on Visuals: The AI sometimes makes spelling errors in image labels. Please refer to the lesson text for the correct terminology.