Learning Journey
Watch this topic in 60 seconds
Free preview · Lesson 1
Understanding Statistics All Around Us
Statistics All Around Us: Unlocking the Secrets of Data
Hey there, future data detectives! Have you ever wondered how people know what the most popular ice cream flavor is, or how sports teams decide which players are doing best, or even how scientists predict the weather? The secret isn't magic; it's something called statistics! Statistics might sound like a big, fancy word, but it's actually super helpful and happens all around us, every single day.
What Exactly IS Statistics? (It's Like Being a Super Sleuth!)
Imagine you're trying to figure out something important. Maybe you want to know what kind of snacks your friends like best for a party. How would you find out? You'd probably ask them, right? You'd gather information. That information is called data, and the process of collecting, organizing, understanding, and talking about that data is what statistics is all about!
Think of statistics like being a super sleuth or a detective. Detectives collect clues (data), organize them, look for patterns, and then use those clues to solve a mystery or understand a situation. Statistics helps us solve the "mysteries" of the world around us, from simple things like favorite colors to more complex ideas like how many people live in your town.
Building Blocks of Statistics: Understanding Data
The first and most important thing in statistics is data. What is data? Data is just information – facts, numbers, words, observations. It's the raw material we work with. Think of data as LEGO bricks. You can't build a cool castle without bricks, and you can't do statistics without data!
- Numbers as Data: How many siblings do you have? (2, 0, 1)
- Words as Data: What's your favorite animal? (Dog, Cat, Dolphin)
- Observations as Data: What color shirt is everyone wearing today? (Blue, Red, Green)
Every time you count something, measure something, or ask a question and get an answer, you're collecting data!
Step 1: Collecting Data – Becoming a Data Detective!
How do we get all these useful "LEGO bricks" of information? We collect them! There are many ways to collect data:
- Surveys: This is like asking questions to a group of people. If you want to know the most popular pizza topping in your class, you'd survey your classmates by asking them, "What's your favorite pizza topping?" Their answers are your data!
- Observations: Sometimes you just watch and record. If you want to know how many cars pass your house in an hour, you'd sit and count them. You're observing and collecting data without asking anyone anything.
- Experiments: In science class, when you test something to see what happens, you're collecting data!
Imagine you're a chef trying to make a new dish. Before you cook, you need to gather all your ingredients (your data). You can't make a delicious meal if you don't have the ingredients!
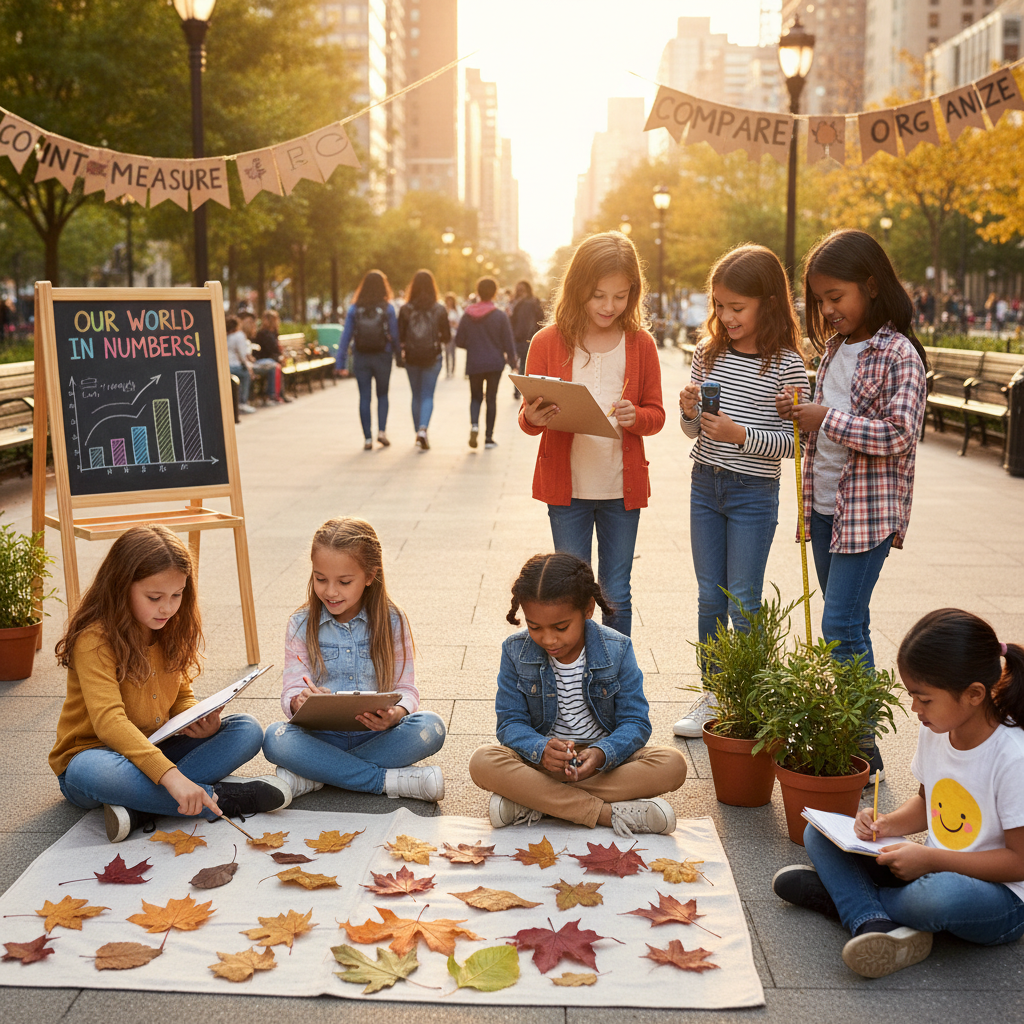
Step 2: Organizing Data – Tidying Up Your Information!
Once you've collected a pile of data, it can look messy, just like a pile of LEGOs dumped on the floor. It's hard to see what you have! The next step in statistics is to organize your data. This means putting it in order or grouping it so it makes more sense.
Think about tidying your room. If all your toys, books, and clothes are in one big mess, you can't find anything. But if you put toys in a toy box, books on a shelf, and clothes in your dresser, suddenly everything is easy to find! It's the same with data.
Common ways to organize data:
- Lists: Just writing down all the information you collected.
- Tally Charts: Using tally marks (those groups of five lines: |||| /) to count how often something appears. This is super handy for categories!
- Frequency Tables: A table that shows how many times each item or number appears.
Example: Let's say you surveyed 10 friends about their favorite fruit and got: Apple, Banana, Orange, Apple, Grape, Banana, Apple, Orange, Banana, Apple.
Organized Tally Chart:
| Favorite Fruit | Tally | Frequency |
|---|---|---|
| Apple | |||| | 4 |
| Banana | ||| | 3 |
| Orange | || | 2 |
| Grape | | | 1 |
See? Much easier to read!
Step 3: Displaying Data – Making Pictures with Your Information!
Once your data is organized, the next step is often to display it in a way that's easy for everyone to understand quickly. This is where graphs and charts come in! Think of graphs as drawing a map or a picture of your data. A picture is often worth a thousand words!
Some common ways to display data:
- Bar Graphs: These use bars of different heights to show quantities. Taller bars mean more of something! They're great for comparing different categories.
- Picture Graphs (Pictographs): These use pictures or symbols to represent data. Each picture might stand for one item or several items (like one apple symbol = 2 real apples).
- Line Plots (Dot Plots): These use a number line and X's or dots to show how often a number appears. Great for showing the spread of numbers.
Using our fruit example, a bar graph would have bars for Apple, Banana, Orange, and Grape, with the Apple bar being the tallest (4), and the Grape bar being the shortest (1).
Step 4: Interpreting Data – What Does It All Mean?
Collecting, organizing, and displaying data are all important, but the most exciting part is interpreting it. This means looking at your organized data or your graph and figuring out what it's telling you. What patterns do you see? What conclusions can you draw? What "mystery" did you solve?
Going back to our fruit example, if you look at the tally chart or a bar graph, you'd quickly see that "Apple" is the favorite fruit among your friends, and "Grape" is the least favorite. You could then use this information to buy the right fruits for your party!
Interpreting data is like reading a story that your data is telling you. You look at all the clues and put them together to understand the full picture.
Important Words in Statistics (Your Data Vocabulary!)
Just like any subject, statistics has its own special words. Here are a few important ones:
- Population: This is the ENTIRE group of people, animals, or things that you are interested in. If you want to know the favorite sport of ALL 6th graders in your country, then all 6th graders in your country are your population.
- Sample: Often, it's too hard to ask everyone in a population. So, you pick a smaller group from the population, called a sample. If you ask 100 6th graders from different schools about their favorite sport, those 100 6th graders are your sample. A good sample needs to represent the whole population fairly.
- Survey: A method of collecting data by asking questions to a group of people.
- Graph: A visual way to display and compare data, like bar graphs or picture graphs.
- Mean (or Average): This is one way to find the "center" of a set of numbers. To find the mean, you add up all the numbers and then divide by how many numbers there are. Think of it as sharing everything equally. If you have 3 cookies, 5 cookies, and 4 cookies, and you want to share them equally among 3 friends, you add them (3+5+4 = 12) and divide by 3 (12/3 = 4). So, the mean is 4 cookies per person.
- Median: Another way to find the "center." It's the middle number when all your numbers are put in order from smallest to largest. If you have 2, 5, 8, the median is 5. If you have 2, 3, 5, 8, the median is between 3 and 5.
- Mode: The number or item that appears MOST OFTEN in your data set. If your favorite colors are Red, Blue, Red, Green, Blue, Red, then Red is the mode because it appeared three times.
- Range: This tells you how spread out your data is. You find it by subtracting the smallest number from the largest number. If test scores were 60, 70, 80, 90, 100, the range would be 100 - 60 = 40.
Statistics Everywhere! Real-World Examples
Statistics isn't just for math class; it's used in countless ways every day:
- Sports: Coaches use statistics to see which players are performing best (number of goals, free throws made, tackles). Fans use stats to predict who will win a game.
- Weather: Meteorologists (weather forecasters) use statistics from past temperatures, rainfall, and wind speeds to predict tomorrow's weather.
- School: Teachers use statistics to see how well students are doing on tests, or how many students prefer certain activities.
- Games: Video game designers use statistics to understand how players play their games and what improvements to make.
- Shopping: Stores use statistics to know which products are most popular so they can stock more of them.
- Health: Doctors and scientists use statistics to understand how medicines work or how diseases spread.
From your favorite cereal company deciding what new flavor to make, to your city planning where to build a new park, statistics helps people make smart decisions based on real information.
Conclusion: You're Already a Statistics Whiz!
See? Statistics isn't scary at all! It's just a systematic way of gathering information (data), making sense of it, and using it to understand the world better. You've probably been doing some form of statistics all your life without even realizing it! Now you know the proper names for these steps and tools. Keep your eyes open, and you'll start seeing "Statistics All Around Us" every single day!
Keep learning, free
Create a free Syllabax account to unlock practice questions and games for this topic.
Visual Learning Enhanced! 🚀
To help you master this topic, we use Advanced Syllabax AI to generate detailed diagrams and visual models.
Note on Visuals: The AI sometimes makes spelling errors in image labels. Please refer to the lesson text for the correct terminology.