Flowcharts for Problem Solving
Watch this topic in 60 seconds
Free preview · Lesson 1
Understanding Flowcharts for Problem Solving
Flowcharts for Problem Solving: Navigating Your Way to Solutions
Welcome, problem-solvers of Grade 9! Have you ever tried to explain a complex task to someone, only to find yourselves getting tangled in words? Or maybe you've had a big project and weren't sure where to start? That's where flowcharts come in! Think of them as your secret weapon for breaking down tough problems into simple, manageable steps, just like following a treasure map to find the buried gold.
What is Problem Solving, Anyway?
Before we dive into flowcharts, let's talk about problem-solving. It's not just for math class! Problem-solving is the art of finding solutions to challenges, big or small. From deciding what to wear in the morning based on the weather, to figuring out how to build a model airplane, or even debugging a computer program – it's all problem-solving. It's like being a detective, looking for clues, making connections, and ultimately catching the culprit (the solution!).
Why Are Flowcharts So Awesome for Problem Solving?
Imagine you're trying to bake a cake for the first time. You could just jump in, but chances are, you'd forget an ingredient or mix things in the wrong order. A recipe, with its clear, step-by-step instructions, is like a mini-flowchart. It guides you from "Gather Ingredients" to "Enjoy Cake."
Flowcharts do exactly that, but for any problem. They help you:
- See the Big Picture: Like a bird's-eye view of a landscape, they show you all the steps from start to finish.
- Break It Down: They chop large, scary problems into smaller, bite-sized tasks that are easier to handle.
- Make Decisions Clear: Sometimes, a problem has different paths depending on certain conditions (like "If it's raining, take an umbrella"). Flowcharts make these choices obvious.
- Communicate Better: A picture is worth a thousand words! A flowchart can explain a process far more clearly than a long paragraph of text.
- Find Mistakes (Bugs): If something goes wrong, you can follow your flowchart step-by-step to pinpoint exactly where the problem occurred. It's like tracing your steps back on a hiking trail to see where you took a wrong turn.
Unpacking the Flowchart: What Are Its Parts?
A flowchart is a visual diagram that uses different shapes to represent different types of steps in a process, and arrows to show the order of those steps. Think of it like a special language that uses shapes instead of letters.
The Essential Flowchart Symbols (Your Problem-Solving Toolkit!)
Just like every game has its rules and special pieces, flowcharts have a few basic shapes that you'll use all the time. Let's meet them:
-
The Oval (Start/End - The "Terminal")
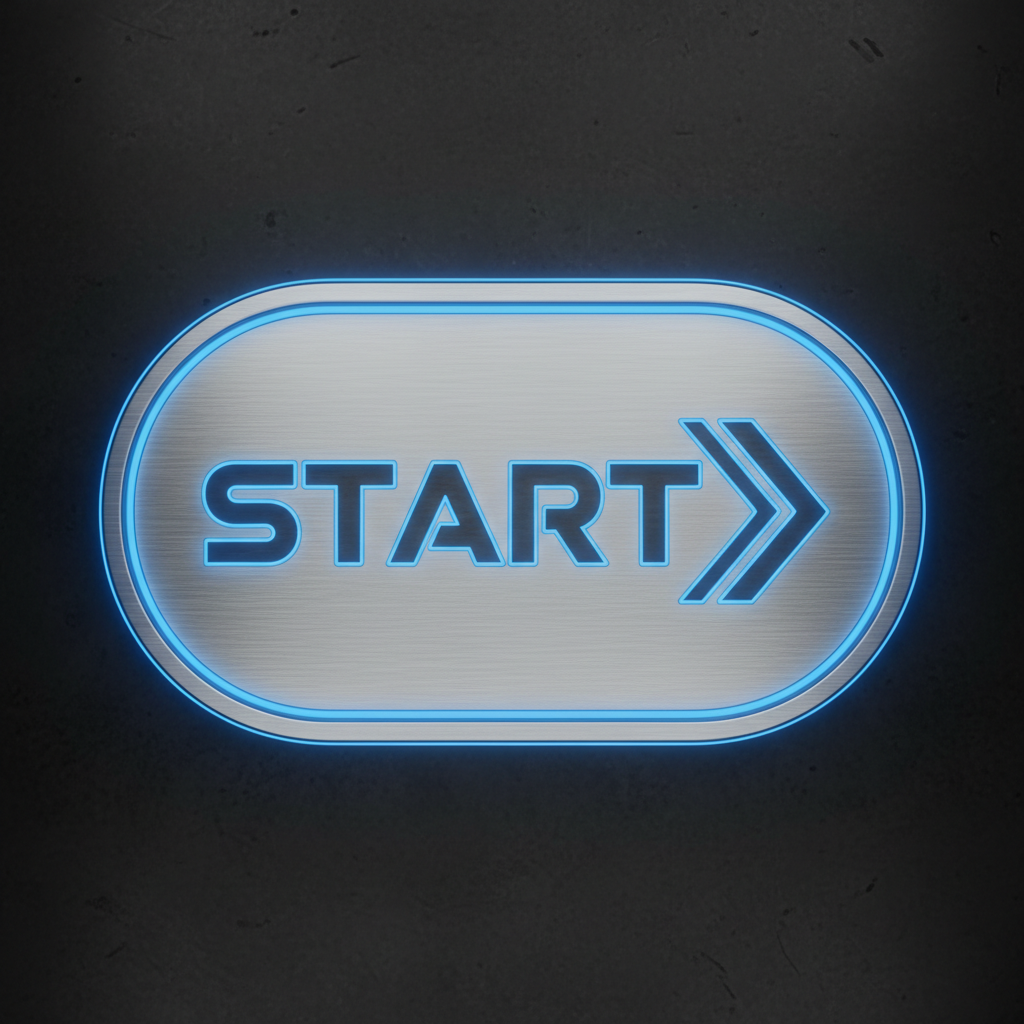
What it looks like: A stretched-out circle, like a rugby ball or an egg.
What it means: This symbol is used for the very beginning (START) and the very end (END) of your process. It's like the "Go" and "Stop" signs for your problem-solving journey. Every good story has a beginning and an end, and so does every flowchart!
Analogy: Think of it as the "ON" and "OFF" buttons on an electronic device, or the "Start Line" and "Finish Line" of a race.
-
The Rectangle (Process/Action)
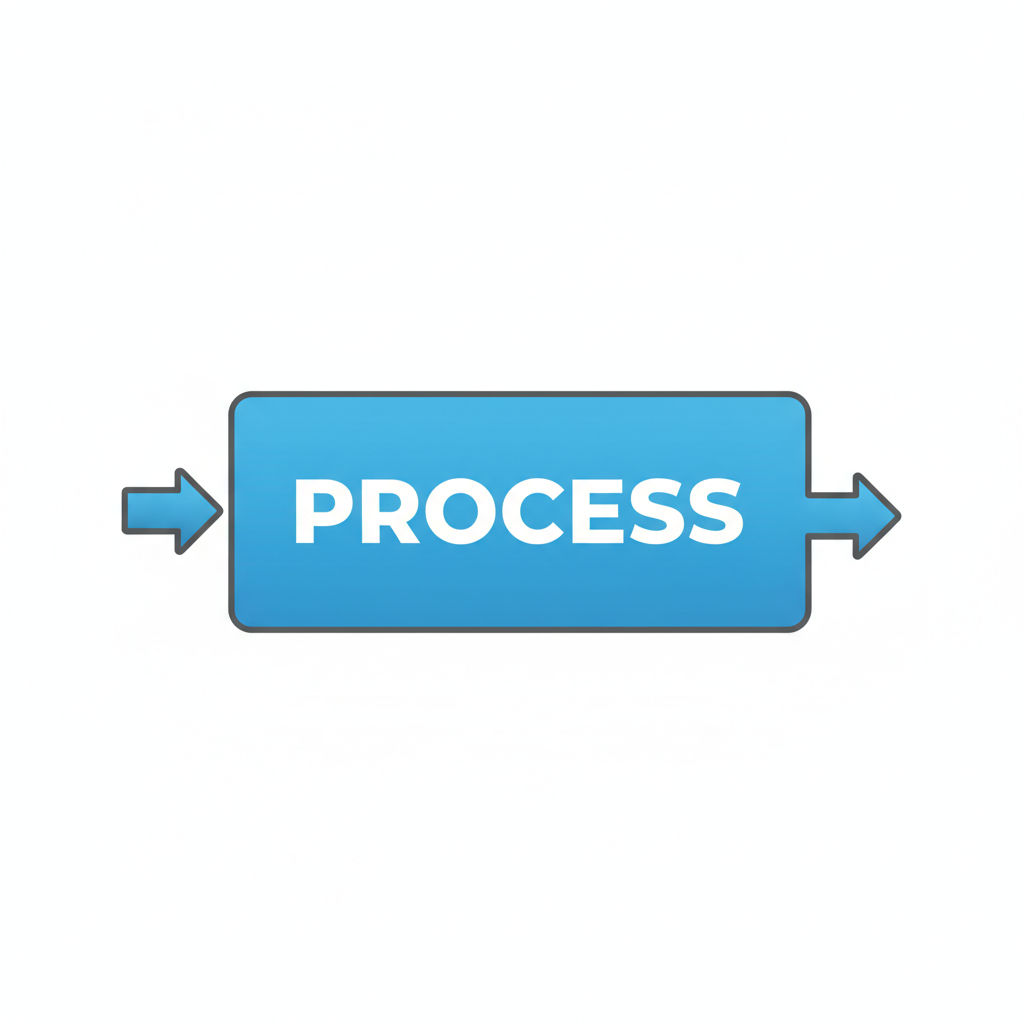
What it looks like: A standard four-sided box.
What it means: This is where you describe an action, a step, or a task that needs to be performed. It's a "do" step. Most of your flowchart will be filled with these! For example, "Bake Cake," "Mow Lawn," "Write Essay," "Calculate Total."
Analogy: These are the "action verbs" of your flowchart – the things you actually do. In a recipe, these are steps like "Mix ingredients," "Pour batter," or "Preheat oven."
-
The Diamond (Decision)
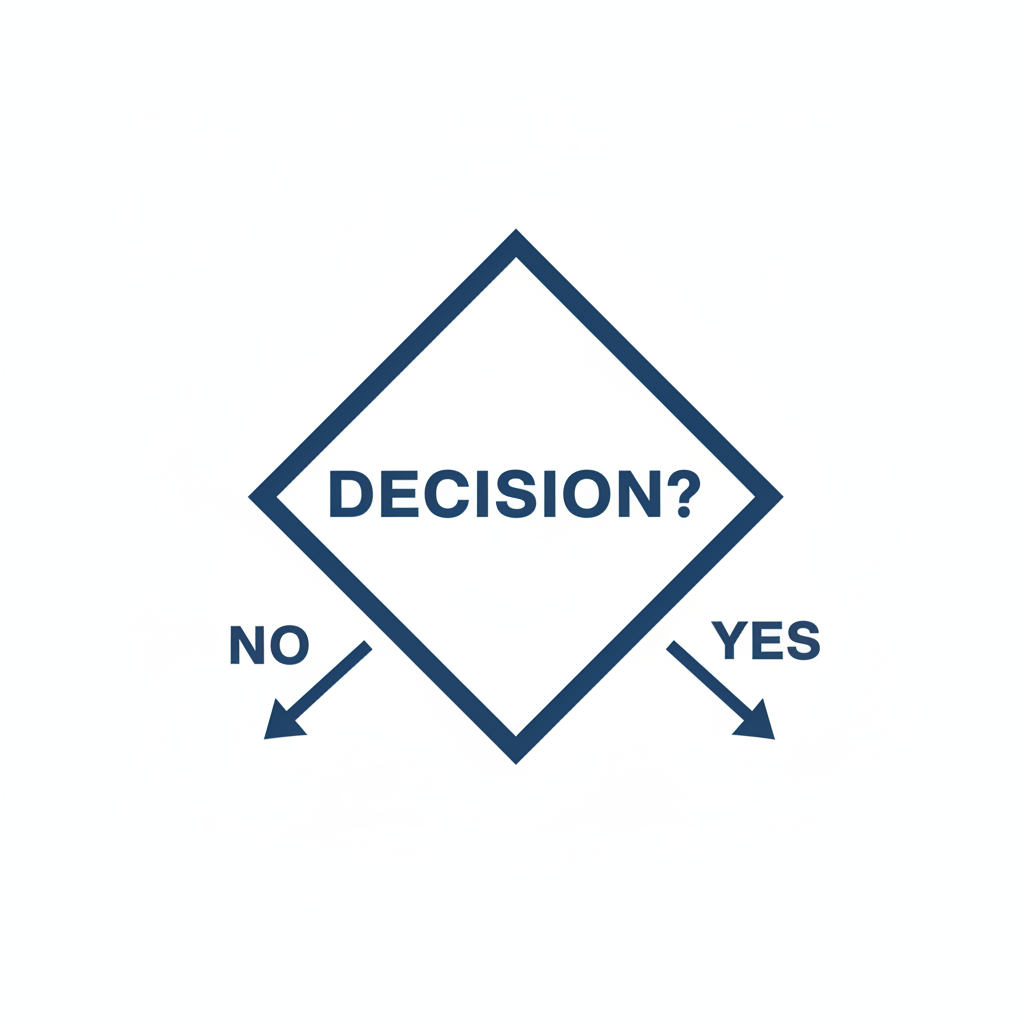
What it looks like: A four-sided shape with points at the top, bottom, and sides, like a diamond or a kite.
What it means: This symbol represents a point where you have to make a choice or answer a question, usually with a "Yes" or "No" answer. From a decision symbol, there will always be at least two paths leading out, representing the different outcomes of your choice. For example, "Is it raining?", "Do I have enough money?", "Is the light green?".
Analogy: This is like a "fork in the road" on your journey. You have to decide which path to take. Or, think of it as an "If... then... else..." statement in logic: IF this condition is true, THEN do X, ELSE (if false) do Y.
-
The Parallelogram (Input/Output)
What it looks like: A four-sided shape where opposite sides are parallel, but not all angles are 90 degrees – it's like a rectangle that's been pushed over sideways.
What it means: This symbol is used when you are giving information into the process (Input) or getting information out of the process (Output). For example, "Get student's name," "Enter grade," "Display result," "Print report."
Analogy: Think of it as the "inbox" and "outbox" of your process. Input is like feeding ingredients into a machine, and output is the finished product coming out.
-
Arrows (Flowlines/Connectors)

What it looks like: Simple arrows pointing in one direction.
What it means: These are the most crucial part for showing the sequence or order of steps. They connect all the other symbols and show the direction of flow from one step to the next. You can't have a flowchart without them!
Analogy: These are the "roads" or "paths" that connect different locations on your map. They tell you which way to go next.
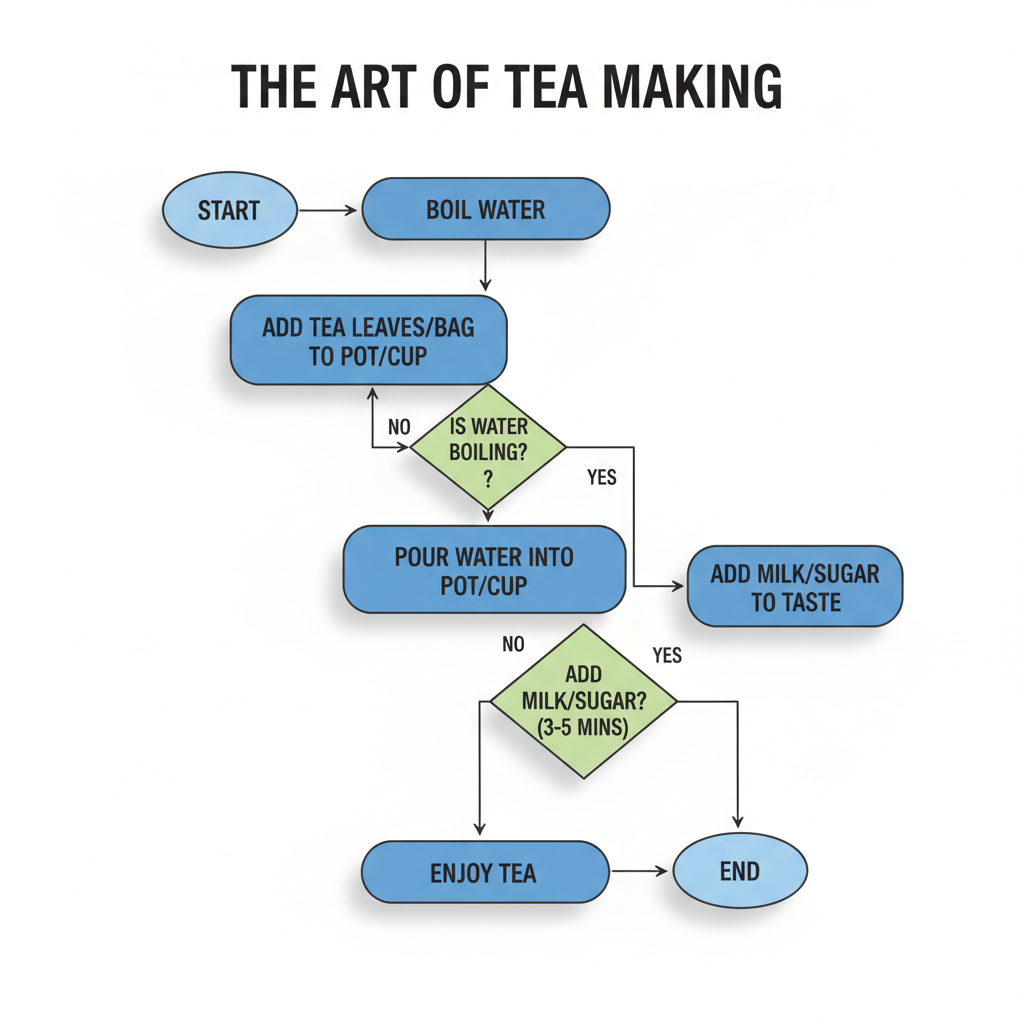 ⚠️ This picture may have spelling mistakes. Trust the words in the lesson.
How to Build Your Own Flowchart (Step-by-Step Guide)
Now that you know the tools, let's build something! Here's a simple guide to creating your very own flowchart:
-
Step 1: Understand the Problem
What exactly are you trying to solve or describe? What's the goal? Before you draw anything, clearly define the problem. For example, "How to decide what to eat for lunch" or "How to log into my computer."
Analogy: This is like understanding the quest given to you in a video game before you set out.
-
Step 2: Identify the Start and End Points
Every process has a beginning and an end. What kicks off the process, and what signifies that it's complete? Use the Oval (Terminal) symbol for these.
Example: For "making a peanut butter sandwich," START would be "Decide to make sandwich," and END would be "Eat sandwich."
-
Step 3: Break Down the Problem into Sequential Steps (Actions)
Think about all the individual tasks that need to happen, one after another. List them out in order. These will mostly be your Rectangles (Process).
Example (Peanut Butter Sandwich): "Get bread," "Get peanut butter," "Get knife," "Spread peanut butter on bread," etc.
-
Step 4: Identify Any Decisions or Choices
Are there any points where you need to ask a question and the answer will change the next step? Use the Diamond (Decision) symbol for these. Remember, decisions usually have "Yes" and "No" (or "True" and "False") paths coming out of them.
Example (Peanut Butter Sandwich): "Do I have bread?" (If No, go buy bread; If Yes, continue). "Do I want jelly?" (If Yes, add jelly; If No, skip jelly).
-
Step 5: Identify Inputs and Outputs
Are you taking any information in (like reading data, getting user input) or displaying any results (like showing a message, printing a document)? Use the Parallelogram (Input/Output) symbol.
Example (Logging into computer): INPUT: "Enter Username," "Enter Password." OUTPUT: "Display 'Welcome' Message" or "Display 'Incorrect Password' Error."
-
Step 6: Connect the Symbols with Arrows (Flowlines)
Draw arrows from one symbol to the next to show the exact sequence of steps. Make sure the arrows always point in the direction of the flow. Don't leave any symbols hanging without an incoming or outgoing arrow (except for Start and End).
Analogy: You're building the roads between all your towns and cities on your map.
-
Step 7: Review and Refine
Once you're done, go through your flowchart step-by-step. Does it make sense? Does it solve the problem effectively? Is anything missing? Are there any steps that can be combined or simplified? Try to imagine someone else following your flowchart – would they understand it?
Analogy: This is like proofreading your essay or test-driving a car you just fixed. You're checking for errors and making sure everything works as intended.
Let's Try a Quick Example: Deciding What to Wear
Imagine you're getting ready for school. Here's how a flowchart might help:
- START: Wake Up
- INPUT: Check Weather Forecast (Parallelogram)
- DECISION: Is it cold? (Diamond)
- YES: PROCESS: Wear warm sweater and pants (Rectangle)
- NO: DECISION: Is it hot? (Diamond)
- YES: PROCESS: Wear t-shirt and shorts (Rectangle)
- NO: PROCESS: Wear light shirt and jeans (Rectangle)
- END: Get Dressed and Ready for School
Notice how the arrows would guide you through each decision until you reach a final outcome. This simple example shows how easily everyday problems can be mapped out visually.
Beyond the Basics: Why Flowcharts Are So Powerful
While we've only covered the foundational symbols, these simple tools are incredibly powerful. They are used in countless fields:
- Computer Programming: Programmers use flowcharts to design the logic of their software before writing a single line of code. It helps them think through every possible scenario.
- Business and Manufacturing: Companies use flowcharts to map out processes, from how a product is assembled to how a customer order is handled. This helps improve efficiency and find bottlenecks.
- Education: Teachers and students use them to break down projects, study complex topics, and organize thoughts.
- Everyday Life: From planning a party to troubleshooting a broken appliance, flowcharts can bring clarity to any situation.
By learning to think in terms of flowcharts, you're not just drawing shapes; you're developing a critical skill: structured problem-solving. You're learning to think logically, to anticipate different outcomes, and to plan effectively. These are skills that will help you succeed not just in school, but in any challenge life throws your way!
So, next time you face a tricky problem, grab a pen and paper (or open a digital drawing tool) and try drawing a flowchart. You might be surprised at how much clearer the path to a solution becomes!
Keep learning, free
Create a free Syllabax account to unlock practice questions and games for this topic.
Visual Learning Enhanced! 🚀
To help you master this topic, we use Advanced Syllabax AI to generate detailed diagrams and visual models.
Note on Visuals: The AI sometimes makes spelling errors in image labels. Please refer to the lesson text for the correct terminology.