Reading Information from Picture Graphs
Watch this topic in 60 seconds
Free preview · Lesson 1
Understanding Reading Information from Picture Graphs
Decoding the Picture Stories: Reading Picture Graphs!
Hey there, young data detectives! Have you ever seen a picture that tells a whole story without using many words? Like a comic strip or a cartoon? Well, today we're going to learn about a special kind of picture story called a picture graph! It's like a secret language that uses pictures to show us how much of something there is.
Imagine you want to know which fruit your friends like best. You could ask everyone and write down their answers, but that might look like a long, messy list. A picture graph helps us show that information in a much neater and easier-to-understand way, using fun pictures!
What is a Picture Graph?
A picture graph, sometimes called a pictograph, is a way to show information or 'data' using pictures or symbols. Instead of long lists of numbers, we use drawings of things to represent how many of something we have. Think of it like a beautiful photo album, but instead of pictures of people, it has pictures of things we are counting!
For example, if you're counting how many red apples, green apples, and yellow apples you have, a picture graph would show little apple drawings for each type. It's a super visual way to compare different amounts quickly.
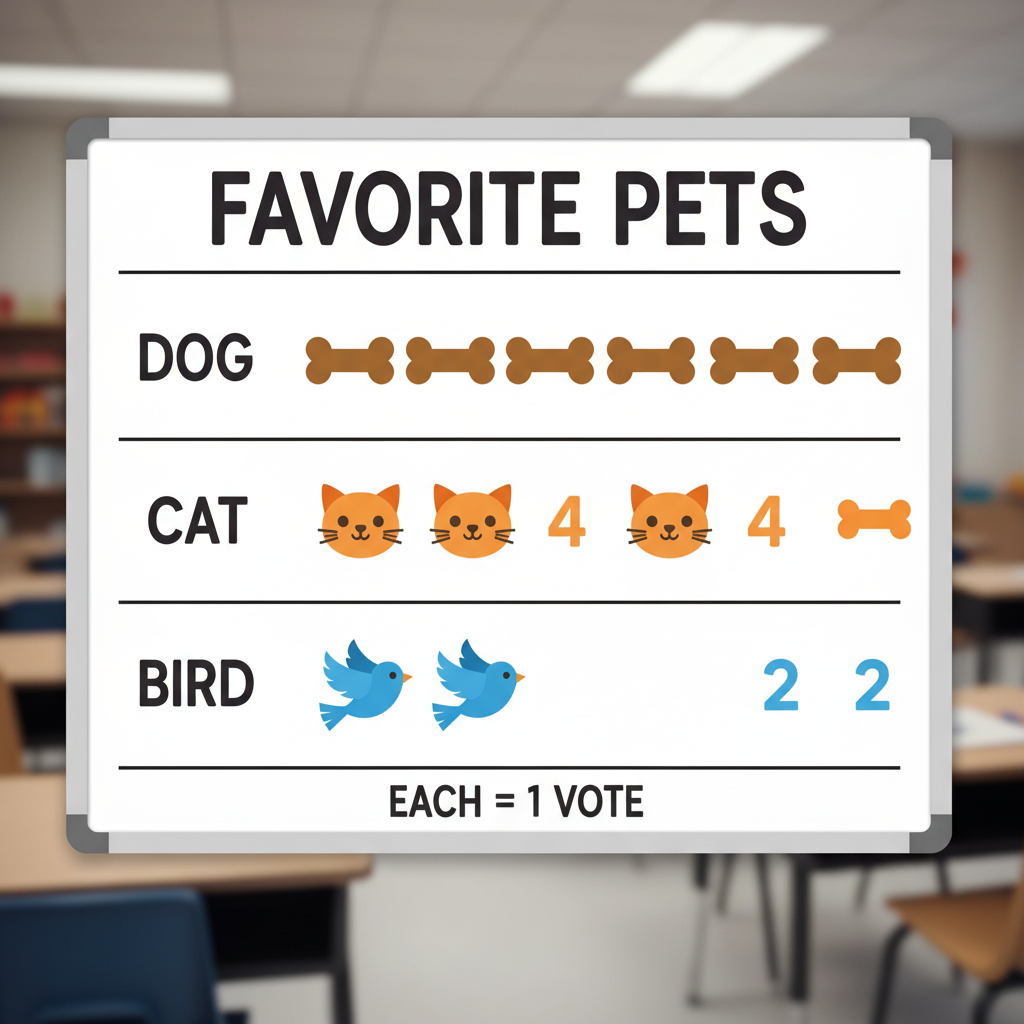 ⚠️ This picture may have spelling mistakes. Trust the words in the lesson.
The Super-Duper Important Parts of a Picture Graph
To read a picture graph like a pro, you need to know its important parts. It's like knowing all the pieces of a puzzle before you can put it together!
1. The Title: What's the Story About?
Every good story has a title, right? A picture graph does too! The title tells you exactly what the graph is all about. Is it about favorite colors? How many pets people have? The title is usually at the very top, so always read it first!
Analogy: Think of the title like the name of a book. It gives you a hint about what you're going to read inside.
2. Categories/Labels: What Are We Counting?
Picture graphs usually compare different groups of things. These groups are called categories or labels. They tell you *what* specifically is being counted. For example, if the graph is about favorite snacks, the categories might be 'Cookies,' 'Chips,' 'Fruit,' and 'Crackers.'
Analogy: If you're organizing your toys, you might have categories like 'LEGOs,' 'Action Figures,' and 'Stuffed Animals.' The graph's categories are just like that!
3. Pictures/Symbols: The Little Stars of the Show!
These are the actual drawings or icons that represent the items being counted. If you're counting apples, you'll see apple pictures. If you're counting cars, you'll see car pictures. They line up next to their categories.
Analogy: The pictures are like the characters in a picture book. Each character helps tell the story of how many there are!
4. The Key/Legend: The Secret Decoder Ring!
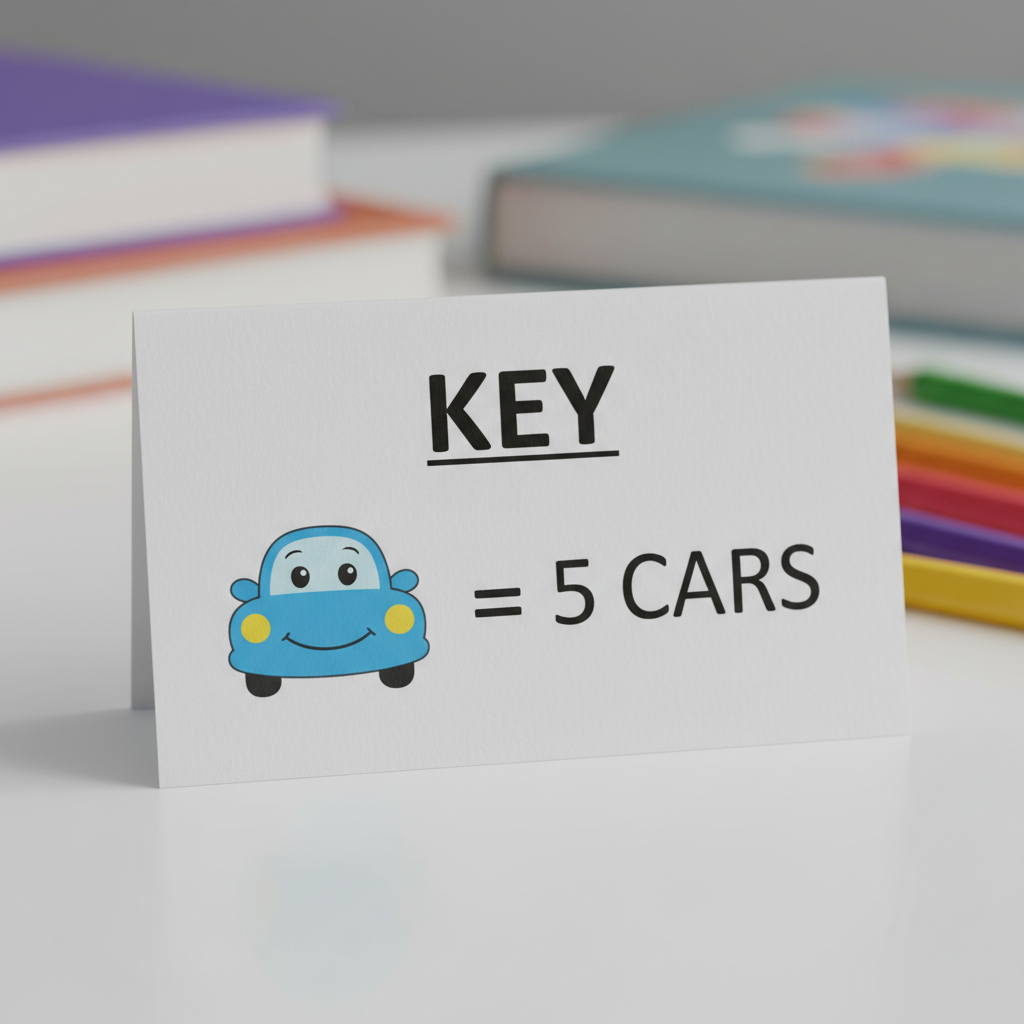
This is the MOST important part of a picture graph, so listen closely! The key (or legend) is like a secret code breaker. It tells you what one picture or symbol stands for. Sometimes one picture means just '1' item. But often, one picture can mean '2' items, '5' items, or even '10' items!
If you don't look at the key, you might count incorrectly. For example, if the key says " = 2 students", then every star picture you see actually means 2 students, not just 1!
Analogy: Imagine you're baking cookies. The recipe (the key) tells you that 1 cup of flour means you add 1 cup of flour. But what if the recipe said "1 spoon symbol = 2 cups of flour"? You'd have to remember to double it! The key is like that recipe – it tells you the 'value' of each picture.
How to Read a Picture Graph Step-by-Step
Ready to put on your detective hat? Here's how to read any picture graph like a pro:
- Step 1: Read the Title. What is the graph about? This gives you the main idea.
- Step 2: Look at the Categories. What different groups of things are being counted?
- Step 3: FIND THE KEY! Seriously, this is super important! Before you count any pictures, find the key and understand what one picture represents. Does one picture mean 1 item? 2 items? 5 items?
- Step 4: Count the Pictures for Each Category. Now, for each category, count how many pictures there are. BUT, remember to multiply by the value from the key!
- Step 5: Answer the Questions! Once you've counted carefully, you can answer questions like: "Which category has the most?" "Which has the least?" "How many more does one have than another?" or "What's the total amount of items?"
Let's Practice with an Example!
Imagine a picture graph titled "Favorite Colors in Class 4B."
- Title: Favorite Colors in Class 4B
- Categories: Red, Blue, Green, Yellow
- Key: = 2 students
If the graph shows:
- Red: 🔴 🔴 🔴 (3 red circles)
- Blue: 🔴 🔴 🔴 🔴 (4 red circles)
- Green: 🔴 🔴 (2 red circles)
- Yellow: 🔴 🔴 🔴 🔴 🔴 (5 red circles)
Let's use our key: 1 red circle = 2 students.
- Red: 3 circles * 2 students/circle = 6 students
- Blue: 4 circles * 2 students/circle = 8 students
- Green: 2 circles * 2 students/circle = 4 students
- Yellow: 5 circles * 2 students/circle = 10 students
See? If you didn't look at the key, you might think only 3 students liked Red, but actually, 6 students liked it! The key is your superpower!
Comparing and Answering Questions
Once you've used the key to find the actual numbers, answering questions is easy-peasy!
- Which color is liked by the most students? Yellow (10 students)
- Which color is liked by the fewest students? Green (4 students)
- How many more students like Blue than Green? 8 (Blue) - 4 (Green) = 4 more students
- How many students were surveyed in total? 6 + 8 + 4 + 10 = 28 students
So, whenever you see a picture graph, remember to be a data detective. Find the title, see the categories, count the pictures, but most importantly, always, always, FIND AND UNDERSTAND THE KEY! It's your map to unlocking all the hidden information in the graph.
Keep learning, free
Create a free Syllabax account to unlock practice questions and games for this topic.
Visual Learning Enhanced! 🚀
To help you master this topic, we use Advanced Syllabax AI to generate detailed diagrams and visual models.
Note on Visuals: The AI sometimes makes spelling errors in image labels. Please refer to the lesson text for the correct terminology.