Making Picture Graphs
Watch this topic in 60 seconds
Free preview · Lesson 1
Understanding Making Picture Graphs
Making Picture Graphs: Telling Stories with Pictures!
Hey there, young data detectives! Have you ever wanted to tell a story without using too many words? Imagine showing how many cookies your class ate, or how many different colors of shirts your friends are wearing, just by using pictures! That's exactly what a picture graph does! It's like a special kind of chart that uses pictures or symbols to show information, making it super easy to understand at a glance.
Think of it this way: If I told you, "There are 10 apples, 5 bananas, and 15 oranges," that's a lot of numbers. But if I showed you pictures of 10 apples, 5 bananas, and 15 oranges, wouldn't it be much clearer and more fun? That's the magic of picture graphs!
What is a Picture Graph?
A picture graph is a way to display data (which is just information or facts, like how many of something there are) using pictures or symbols. Each picture or symbol stands for a certain number of items. It’s a bit like creating a visual tally system!
Why Do We Use Picture Graphs?
- Easy to Understand: They make numbers and data much simpler to see and compare. You can quickly spot which category has the most or the least.
- Fun to Look At: Pictures are often more engaging than just plain numbers.
- Quick Comparisons: You can instantly tell which group is bigger or smaller by just looking at the rows of pictures.
The Important Parts of a Picture Graph (Like Pieces of a Puzzle!)
Just like a bicycle has different parts (wheels, handlebars, pedals) that all work together, a picture graph has different parts that make it work. Let's look at them:
1. The Title: What's Our Story About?
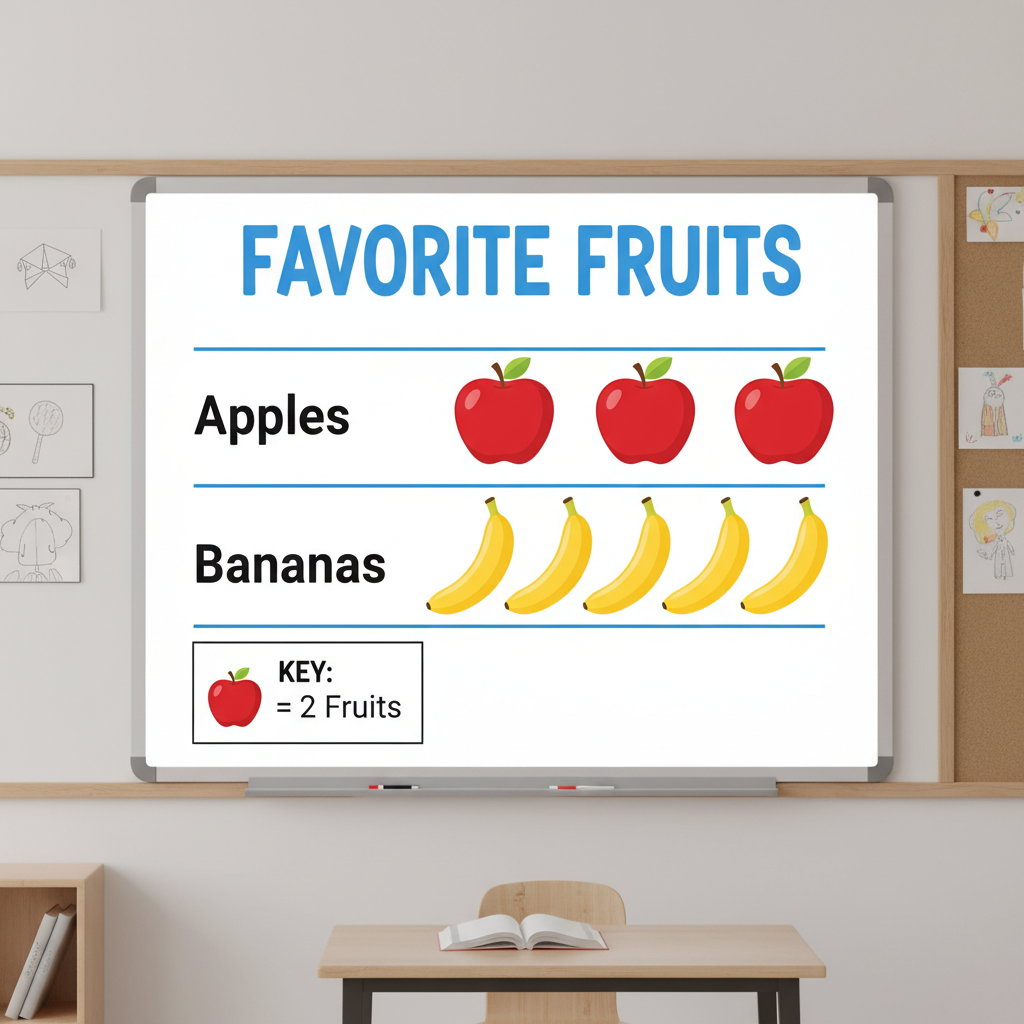
Every good story needs a title, right? A picture graph also needs a title! The title tells you exactly what information the graph is showing. It should be clear and concise. For example, 'Favorite Pets' or 'Number of Books Read This Month'. Without a title, you wouldn't know what you're looking at!
2. Categories/Labels: What Are We Comparing?
These are the different groups or types of things you are comparing. If your graph is about 'Favorite Fruits', your categories might be 'Apples', 'Bananas', 'Oranges', and 'Grapes'. These are usually listed down the side or across the bottom of the graph.
3. The Pictures/Symbols: Our Visual Clues!
These are the actual images you draw to represent the data. If your graph is about 'Favorite Pets', you might draw little dog pictures, cat pictures, or fish pictures. The key is that each picture should be simple and easy to draw repeatedly.
4. The Key (The Secret Decoder!): How Much Does Each Picture Count For?
This is arguably the MOST IMPORTANT part of a picture graph. The key, also sometimes called a legend, tells you what each single picture or symbol stands for. For example, if your graph is about 'Number of Books Read', your key might say: " = 2 books". This means every time you see a picture of a book, it actually represents TWO books, not just one! The key is like a secret code you need to unlock the graph's information.
Why do we use a key that makes one picture stand for more than one item? Imagine if your class read 100 books! Drawing 100 tiny book pictures would take forever and make the graph super long. By saying " = 10 books", you would only need to draw 10 book pictures to show 100 books – much easier!
Let's look at an example of a picture graph with all its parts:
How to Read a Picture Graph (Become a Graph Detective!)
Reading a picture graph is like solving a fun puzzle. Here's how you do it:
- Look at the Title First: What is the graph about? This gives you the main idea.
- Check the Categories: What different groups or items are being compared?
- Find the Key: This is your secret decoder! What does each picture or symbol represent? Is it 1, 2, 5, or even 10 items? This is super important for counting correctly.
- Count the Pictures: For each category, count how many pictures there are. Then, multiply that count by the number shown in the key.
Example: Let's say a graph shows 'Favorite Colors' and the key says " = 3 students".
- If the 'Blue' category has 4 stars, that means 4 x 3 = 12 students like blue.
- If the 'Red' category has 2 stars, that means 2 x 3 = 6 students like red.
How to Make Your Own Picture Graph (Time to Be an Artist and a Scientist!)
Making a picture graph is a super useful skill. It's like gathering ingredients and baking a cake – you need all the right steps!
Step 1: Gather Your Data (Collect Your Ingredients!)
First, you need information! This is called 'data'. You might ask your friends about their favorite ice cream flavors, or count how many red cars you see on the way to school. Let's say we asked 20 classmates about their favorite sports and got this data:
- Soccer: 8 students
- Basketball: 6 students
- Swimming: 4 students
- Tennis: 2 students
Step 2: Choose a Title (Name Your Cake!)
What is your graph about? A good title for our data above would be 'Favorite Sports of Class 5A'.
Step 3: Choose Your Categories (Organize Your Ingredients!)
List the different items you're comparing. For our example, these would be 'Soccer', 'Basketball', 'Swimming', and 'Tennis'.
Step 4: Choose a Symbol (Pick Your Decorator!)
What picture will you use to represent your data? It should be simple and related to your topic. For 'Favorite Sports', a small picture of a sports ball or a little person running would work well.
Step 5: Decide on Your Key (The Most Crucial Step! How Many Does Each Symbol Stand For?)
This is where you decide how much each picture will represent. Look at your data: 8, 6, 4, 2. All these numbers are even, and they can all be divided by 2. So, letting each picture represent 2 students would be perfect!
Our key will be: " = 2 students"
Remember, choosing a key that makes sense for your numbers is important. If your data was 10, 20, 30, a key of "1 picture = 10 items" would be better. If your numbers are very small, like 1, 2, 3, then "1 picture = 1 item" might be best.
Step 6: Draw Your Symbols (Start Decorating!)
Now, draw the correct number of symbols for each category, using your key. This is where you bring your graph to life!
- Soccer (8 students): Since 1 soccer ball = 2 students, we need 8 ÷ 2 = 4 soccer ball pictures.
- Basketball (6 students): 6 ÷ 2 = 3 basketball pictures.
- Swimming (4 students): 4 ÷ 2 = 2 swimming pictures.
- Tennis (2 students): 2 ÷ 2 = 1 tennis picture.
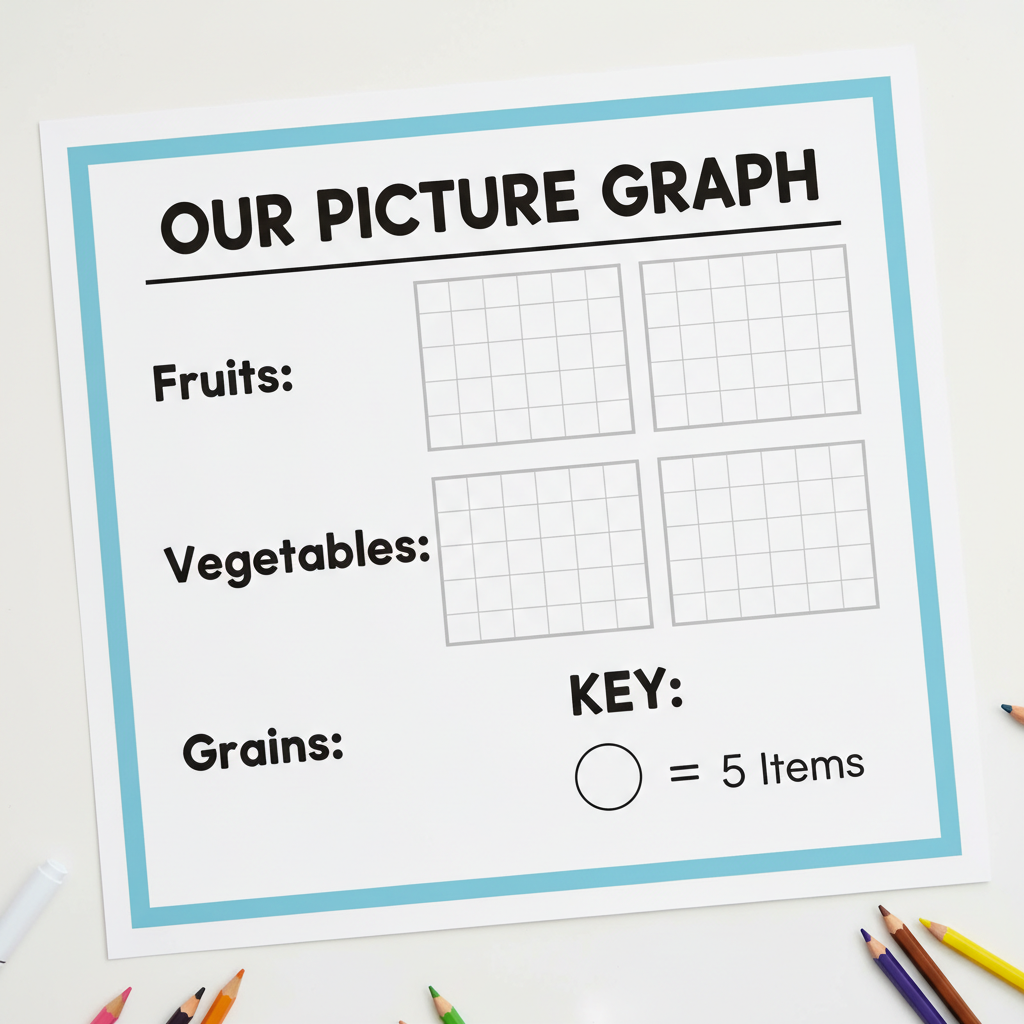
And there you have it! You've made a picture graph. It's a fantastic way to show information clearly and visually.
Let's Review: Picture Graph Power!
Picture graphs are amazing tools for showing information. They help us compare things easily, understand numbers quickly, and they're fun to look at! Just remember the key parts: a clear Title, defined Categories, simple Pictures/Symbols, and the all-important Key that tells you what each picture is worth. With these tools, you'll be a picture graph expert in no time!
Keep learning, free
Create a free Syllabax account to unlock practice questions and games for this topic.
Visual Learning Enhanced! 🚀
To help you master this topic, we use Advanced Syllabax AI to generate detailed diagrams and visual models.
Note on Visuals: The AI sometimes makes spelling errors in image labels. Please refer to the lesson text for the correct terminology.