Bias in Data Collection
Watch this topic in 60 seconds
Free preview · Lesson 1
Understanding Bias in Data Collection
Understanding Bias in Data Collection (Grade 10)
Welcome, 10th graders! Imagine you're trying to figure out what kind of music is most popular among teenagers in your town. If you only ask your friends who all love pop music, do you think your results would truly reflect what *all* teenagers in your town like? Probably not! This is a simple example of something called bias, and it's super important to understand when we're collecting information, or 'data'.
What is Data and Why Does it Matter?
Data is just a fancy word for information or facts. It could be numbers (like test scores, temperatures, or heights) or observations (like favorite colors, opinions, or types of trees). We collect data all the time to make decisions, understand the world, and solve problems. Businesses use data to know what products to sell, scientists use it to understand diseases, and governments use it to plan services.
Think of data as the ingredients for a recipe. If your ingredients are bad or missing, your final dish won't turn out well. Similarly, if your data is biased, any conclusions or decisions you make from it will also be flawed.
The Sneaky Problem: What is Bias in Data Collection?
Bias in data collection happens when the way we gather information unfairly favors certain outcomes or groups, leading to results that don't accurately represent the whole picture or the truth. It's like trying to get a fair picture of a crowd, but your camera lens only captures people wearing red hats. You'd think everyone in the crowd wears a red hat, but that's not true!
Analogy Time: The Uneven Scale
Imagine you're trying to weigh ingredients for a cake, but your kitchen scale is broken and always shows every item as heavier than it actually is. Every cake you make will have too much of certain ingredients because your 'data' (the weight) was biased from the start. That's what bias does to data – it skews the results, making them unreliable and misleading.
Types of Bias You Should Know About
Bias isn't just one thing; it can pop up in different ways. Here are some common types:
1. Sampling Bias: Who Did You Ask (or Not Ask)?
Sampling bias occurs when your method of choosing who or what to collect data from isn't random or representative enough. You end up with a 'sample' (the group you collected data from) that doesn't look like the 'population' (the entire group you want to learn about).
- Analogy: The Fishing Net
Imagine you're a fisherman wanting to know about all the fish in a lake. If your net only has really big holes, you'll only catch large fish and conclude that all fish in the lake are large. You'd miss all the small and medium-sized fish! Your 'sample' (the fish you caught) is biased because your 'sampling method' (the net with big holes) couldn't catch everything.
- Examples of Sampling Bias:
- Convenience Sampling: Only asking your friends because it's easy.
- Volunteer Bias: Only getting opinions from people who *choose* to respond (often those with strong opinions).
- Non-Response Bias: When a significant number of people don't respond to a survey, and the people who *do* respond are different from those who don't.
2. Measurement Bias: How Did You Ask (or Measure)?
Measurement bias happens when the way you collect the data itself is flawed, leading to inaccurate readings or responses. It's not about *who* you ask, but *how* you ask or measure.
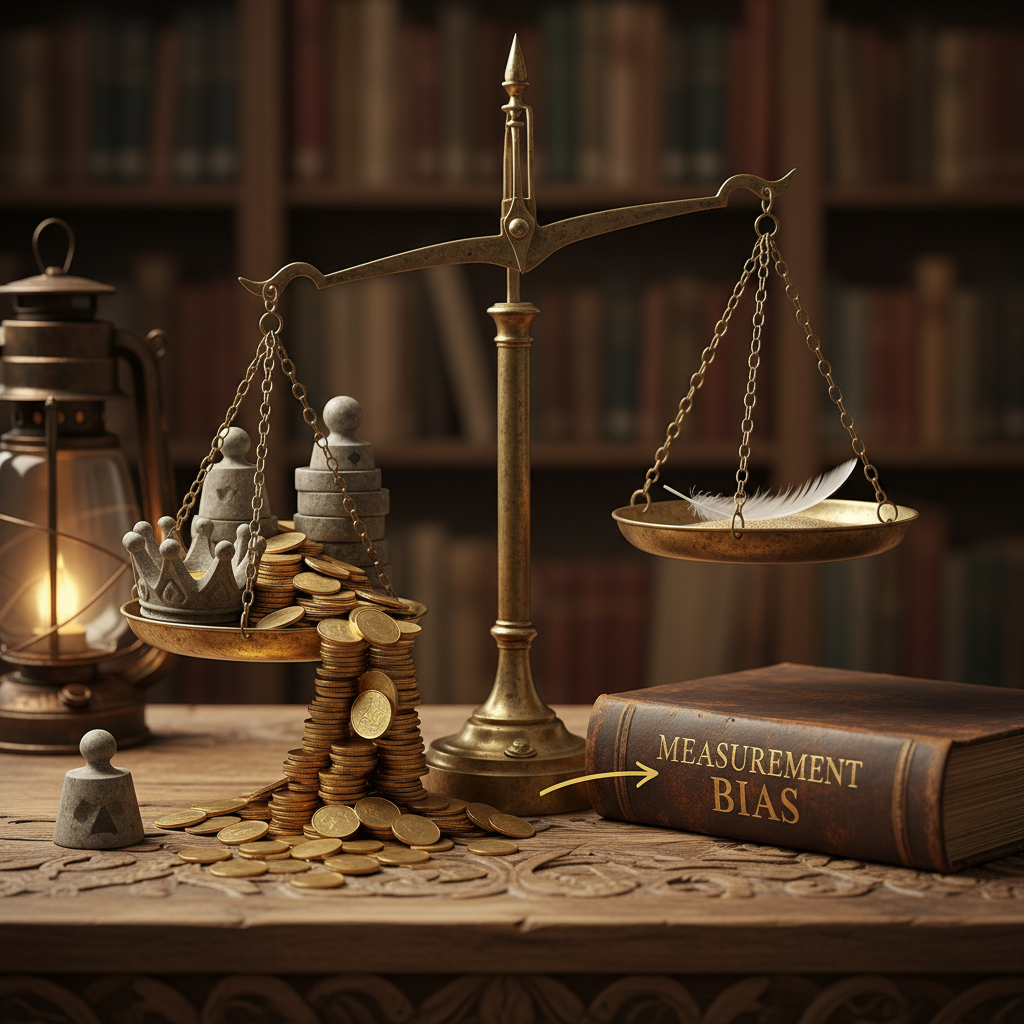
- Analogy: The Faulty Ruler
You need to measure the length of a desk, but your ruler is old and the first inch is worn off. Every measurement you take will be an inch shorter than reality. The ruler itself is causing the bias in your measurements.
- Examples of Measurement Bias:
- Leading Questions: Asking, "Don't you agree that our school lunches are terrible?" This pushes people to agree. A neutral question would be, "What are your thoughts on school lunches?"
- Faulty Instruments: Using a thermometer that always reads two degrees too high.
- Observer Bias: When the person collecting data interprets things based on their own expectations. For example, a teacher grading their favorite student's project more leniently.
3. Response Bias: What Did They Say (vs. What They Meant)?
Response bias occurs when people answer questions in a way that doesn't reflect their true feelings or beliefs. They might do this to seem more socially acceptable, to please the interviewer, or simply because the question structure is confusing.
- Analogy: Telling a White Lie
Your friend asks if you like their new, very strange haircut. You don't want to hurt their feelings, so you say, "It's... unique!" even though you secretly dislike it. Your response is biased because you didn't give your honest opinion.
- Examples of Response Bias:
- Social Desirability Bias: Answering questions in a way that makes you look good or acceptable (e.g., saying you always recycle, even if you don't).
- Acquiescence Bias: Tendency to agree with statements regardless of their content, often to be polite or avoid conflict.
Why Is Bias Such a Big Deal?
Bias is a big deal because it leads to:
- Inaccurate Conclusions: You might think most teenagers love pop music when they actually prefer a variety of genres.
- Unfair Outcomes: If a hiring algorithm is trained on biased data (e.g., mostly male employees), it might unfairly disadvantage female applicants.
- Bad Decisions: A business might launch a product based on biased market research, only to find out people don't want it.
- Wasted Resources: Time, money, and effort spent on flawed data collection and analysis are all wasted.
How Can We Try to Reduce Bias?
While eliminating all bias is extremely difficult, we can take steps to reduce it significantly:
- Random Sampling: Try to ensure everyone in your target population has an equal chance of being selected for your data collection. This is like drawing names out of a hat.
- Clear, Neutral Questions: Phrase questions carefully to avoid leading people to a certain answer.
- Calibrated Instruments: Make sure any tools you're using to measure (like scales, timers, or sensors) are working correctly and accurately.
- Diverse Data Sources: Don't rely on just one type of information or one group of people. Look at many different angles.
- Awareness: Simply knowing that bias exists and actively looking for it can help you spot and correct problems in your data collection.
- Triangulation: Use multiple methods or sources to study the same thing. If different methods yield similar results, you can be more confident in your findings.
Conclusion
Understanding bias in data collection is a fundamental skill in our data-driven world. Whether you're conducting a science experiment, analyzing a poll, or simply reading a news report, being able to recognize potential biases helps you think critically and make better, more informed judgments. Remember the fishing net and the broken scale – good data requires careful, unbiased methods to truly reflect reality!
Keep learning, free
Create a free Syllabax account to unlock practice questions and games for this topic.
Visual Learning Enhanced! 🚀
To help you master this topic, we use Advanced Syllabax AI to generate detailed diagrams and visual models.
Note on Visuals: The AI sometimes makes spelling errors in image labels. Please refer to the lesson text for the correct terminology.