Data in Everyday Life
Watch this topic in 60 seconds
Free preview · Lesson 1
Understanding Data in Everyday Life
Data in Our World: Every Little Bit Counts!
Hey everyone! Have you ever wondered how we know so much about the world around us? How does a teacher know what most students like for snack time? How do we know what the weather will be like tomorrow? The secret is something called data!
What is Data?
Think of data as tiny pieces of information, like little clues. Each clue on its own might not tell you much, but when you put many clues together, they can help you understand a bigger picture!
Analogy Time! Imagine you're baking a cake. You need flour, sugar, eggs, and milk. Each of these ingredients is like a piece of data. If you only have flour, you can't make a cake. But if you have ALL the ingredients (all the data), you can bake a delicious cake and know exactly what's in it! Data is just like that – it's the ingredients for understanding the world.
Data is Everywhere!
You might not even realize it, but data is all around you, every single day! Let's look at some examples:
- At Home: The number of toys you have, the different colors of socks in your drawer, how many apples are left in the fruit bowl, the time you eat dinner.
- At School: The number of students in your class, the favorite color of everyone in your group, how many books are in the library, your height and weight, your scores on a spelling test.
- Outside: The temperature outside, how many cars drive by your house in an hour, the different kinds of birds you see, how many cloudy days there are in a week.
See? Data isn't just numbers! It can be colors, names, descriptions, or observations too. It's any fact or piece of information you can find or measure.
How Do We Collect Data?
Collecting data means gathering all those little clues or ingredients. There are many ways we can do this:
- Observing: This means watching and listening carefully. For example, watching how many red cars pass by your window in 10 minutes.
- Asking Questions: This means talking to people to get their answers. For example, asking all your friends what their favorite animal is.
- Measuring: This means using tools like rulers or thermometers. For example, measuring your height or checking the temperature outside.
- Counting: This is simply finding out how many of something there are. For example, counting how many crayons are in your box.
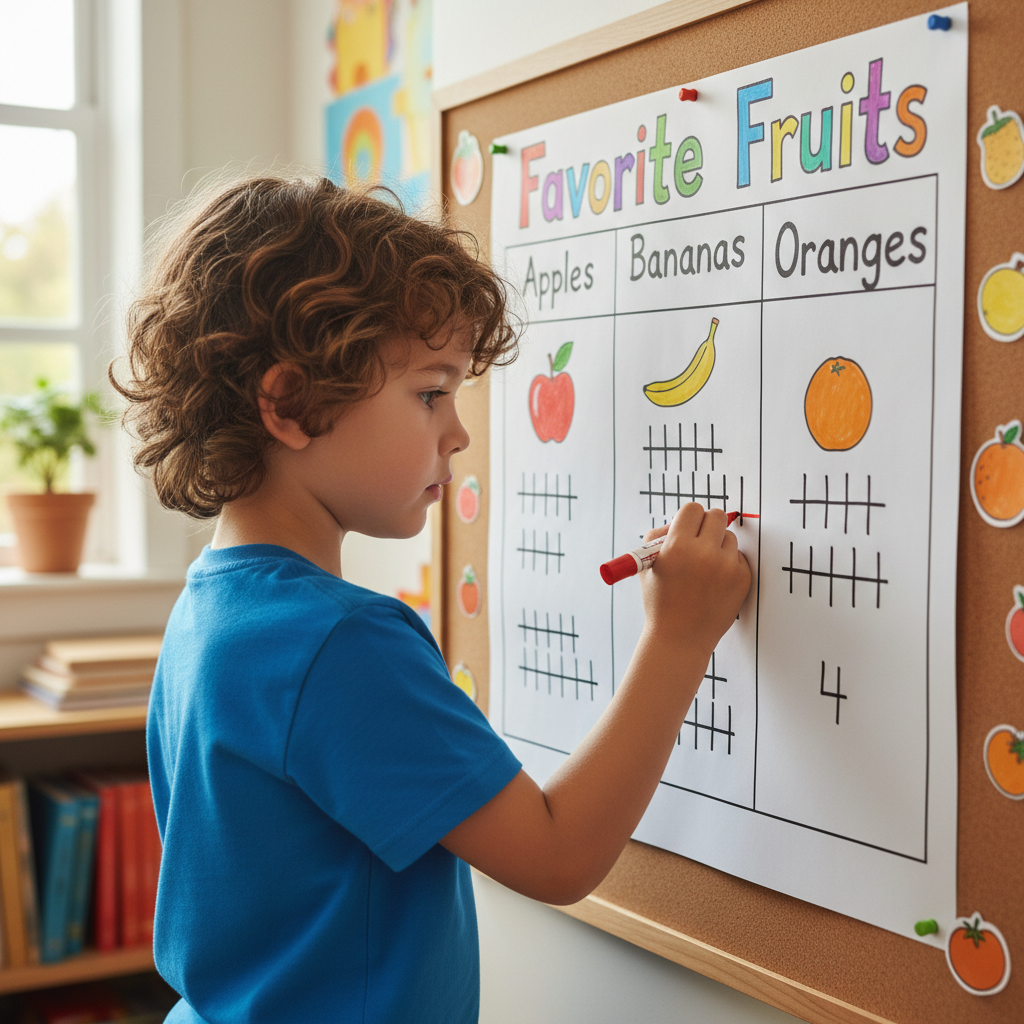
After we collect data, it often looks messy, like a pile of unorganized toys. We need to make sense of it!
Organizing Data: Making Sense of It All
Once we have a lot of data, it's hard to understand if it's just a big jumble. So, we need to organize it! Organizing data means putting it into neat groups or pictures so it's easier to see patterns and understand what's happening.
Analogy Time! Imagine you have a big box of LEGOs. If they're all mixed up, it's hard to find the pieces you need to build something. But if you sort them by color or size, it's much easier to find what you're looking for! Organizing data is just like sorting your LEGOs – it helps you build a clearer picture.
Some common ways to organize data are:
- Tally Charts: These use tally marks (like |||| for five) to count how many of each item you have.
- Picture Graphs (Pictographs): These use small pictures to represent numbers. For example, one happy face might mean one student.
- Bar Graphs: These use bars of different lengths or heights to show amounts. Taller bars mean more of something.
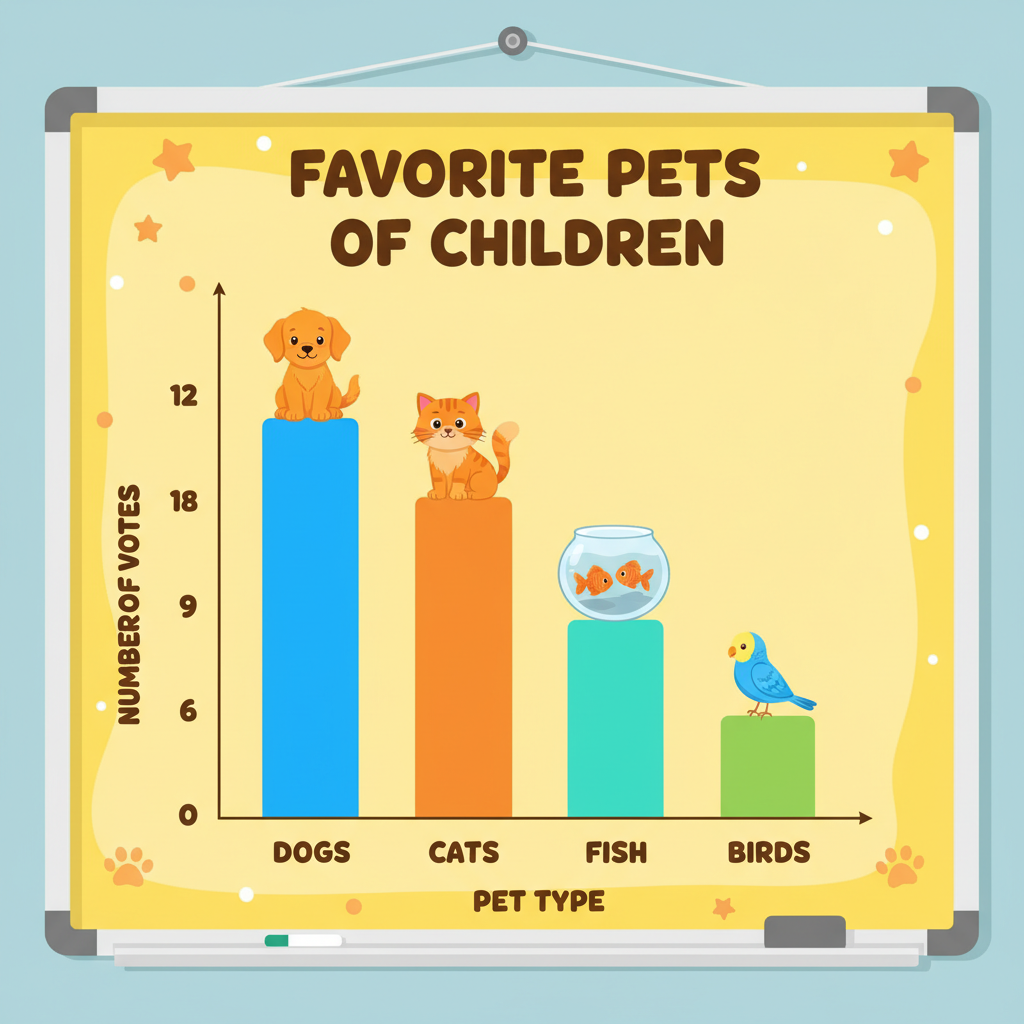 ⚠️ This picture may have spelling mistakes. Trust the words in the lesson.
When data is organized, it's like magic! You can suddenly see things you couldn't before.
What Does Data Tell Us?
The best part about data is that it helps us answer questions and make smart decisions. Once you've collected and organized your data, you can look at it and say:
- "Wow, most kids in our class like pizza the best!"
- "It looks like there are more sunny days than rainy days this month."
- "The biggest plant grew 5 inches in a week!"
Data helps us compare things, find out what's most popular, understand changes over time, and even predict what might happen next. It helps us understand our world a little better, one tiny piece of information at a time!
Why Data Matters
From deciding what to pack for a picnic based on the weather forecast (which is based on data!), to knowing what snack to bring for the class party (based on everyone's preferences – data!), data helps us every day. It's a powerful tool for learning and making smart choices!
Keep learning, free
Create a free Syllabax account to unlock practice questions and games for this topic.
Visual Learning Enhanced! 🚀
To help you master this topic, we use Advanced Syllabax AI to generate detailed diagrams and visual models.
Note on Visuals: The AI sometimes makes spelling errors in image labels. Please refer to the lesson text for the correct terminology.