Learning Journey
Watch this topic in 60 seconds
Free preview · Lesson 1
Understanding Reading Line Plots
Reading Line Plots: Making Sense of Data!
Hey there, future data detectives! Have you ever wondered how to quickly understand information that people have collected, like how many pets your friends have, or how many hours they spend playing outside? Well, today we're going to learn about a super cool tool called a Line Plot! It's like a special picture that helps us see how often things happen.
What is a Line Plot? Think of it like a Tally Chart on a Number Line!
Imagine you're collecting stickers. Instead of just having a big pile, you might sort them by color. A line plot does something similar with numbers! It helps us organize and show how many times each number appears in a set of data.
Think of it this way: if you have a bunch of friends and you ask them all how many books they read last month, you might get a list like this: 3, 4, 2, 3, 5, 3, 4, 2, 3, 1. That's just a jumble of numbers! A line plot helps us turn that jumble into a clear, easy-to-understand picture.
Analogy Time: Think of a line plot like a special kind of ruler where, instead of measuring length, you're putting sticky notes (or 'X's) above the numbers to show how many times they appear. Each sticky note means 'one time'!
The Important Parts of a Line Plot
Just like a storybook has a title and pages, a line plot has a few important parts that help us read it. Let's break them down:
-
The Title: What's This All About?
Every good line plot starts with a title. The title tells you exactly what kind of information you are looking at. It's like the title of a book – it gives you a clue about the story inside! If the plot is about the number of siblings students have, the title might be 'Number of Siblings in Our Class'.
Analogy Time: The title is like the label on a box. It tells you what goodies are stored inside!
-
The Number Line: Our Data's Highway!
Below the X's, you'll see a straight line with numbers written on it. This is called the number line. It's just like the number line you use in math class! These numbers represent the different values in your data (like 0 pets, 1 pet, 2 pets, etc.). It helps us see the spread of our data.
Analogy Time: Think of the number line as a highway. Each number is like an exit ramp, and the cars (our 'X's) are parked at the correct exit based on their value.
-
The X's (or Dots): Each One Tells a Story!
This is where the magic happens! Above each number on the number line, you'll see a collection of 'X's (or sometimes dots). Each single 'X' represents one piece of data. So, if there are three 'X's above the number '2', it means that the number '2' appeared three times in our data set. For example, three students might have read 2 books each.
Analogy Time: Imagine each 'X' is a student who gave that specific answer. If a number has five 'X's above it, it means five students gave that answer!
Here’s what these parts look like together:
How to Read a Line Plot: Your Step-by-Step Guide!
Reading a line plot is like solving a simple puzzle. Let's go through the steps:
-
Step 1: Read the Title! Start by reading the title to understand what the plot is telling you. Is it about "Number of Dogs Owned" or "Hours Spent Playing Video Games"?
-
Step 2: Look at the Number Line! Understand what the numbers on the bottom mean. Are they counting books, pets, or something else? Make sure you know what each number represents.
-
Step 3: Count the X's! To find out how many times a certain number appeared, just go to that number on the line and count how many 'X's are stacked directly above it. Each 'X' is one vote, one item, one count!
Let's look at an example to practice!
Imagine this line plot shows the number of sunny days in a particular city for 10 different weeks:
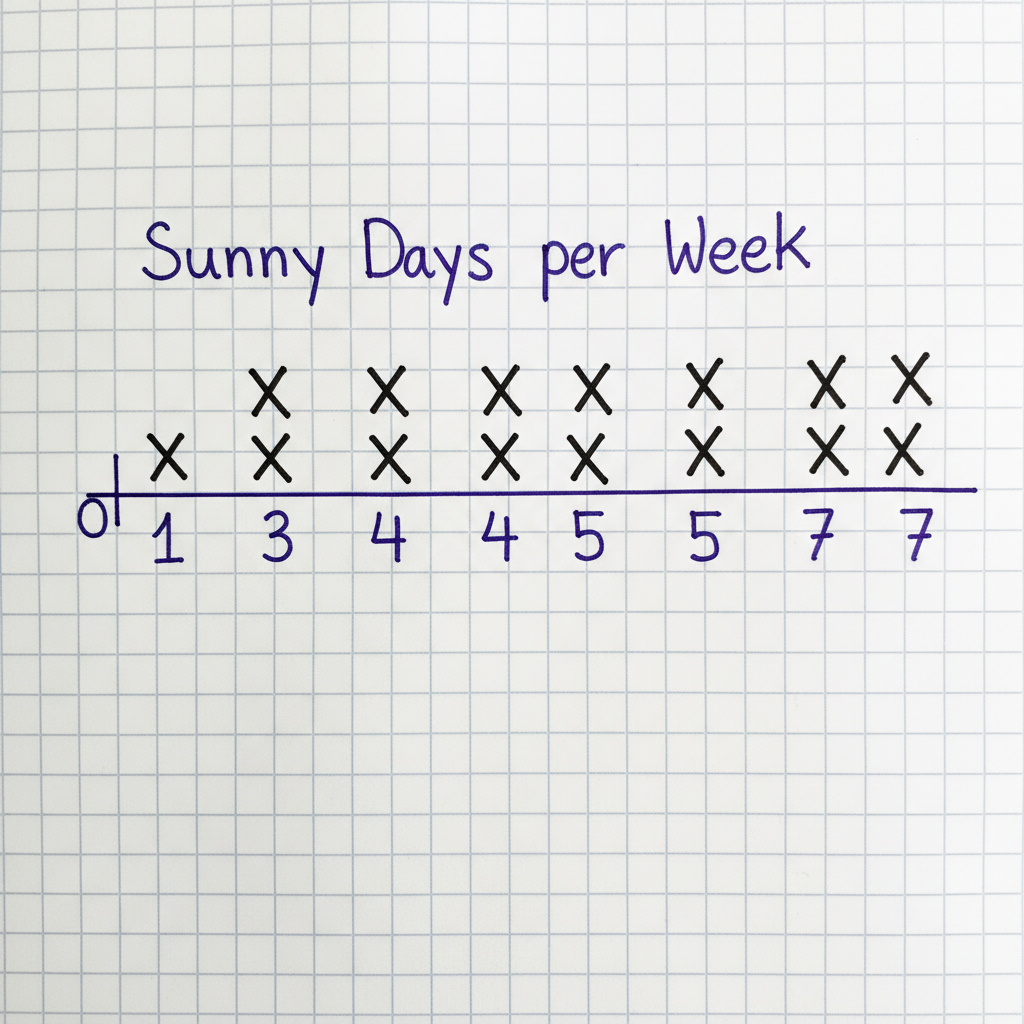
Let's ask some questions about this line plot:
- Question 1: How many weeks had exactly 3 sunny days?
- Answer: Find the number '3' on the number line. Count the 'X's above it. There are two 'X's. So, 2 weeks had 3 sunny days.
- Question 2: What was the most common number of sunny days in a week?
- Answer: Look for the number with the tallest stack of 'X's. Both '4' and '7' have three 'X's. So, 4 days and 7 days were the most common.
- Question 3: How many total weeks are represented in this data?
- Answer: Count *all* the 'X's on the entire plot. 1 (above 1) + 2 (above 3) + 3 (above 4) + 1 (above 5) + 3 (above 7) = 10 total 'X's. So, 10 weeks are represented.
Why are Line Plots Useful?
Line plots are great because they give us a quick and clear visual summary of data. Instead of looking at a long list of numbers, we can see patterns and answers to questions at a glance! They help us answer questions like:
- What was the most popular answer? (The tallest stack of X's)
- What was the least popular answer? (The shortest stack, or no X's at all!)
- How many people chose a specific answer? (Count the X's above that number)
- How many total people were asked? (Count ALL the X's!)
You're now a line plot pro! Keep practicing, and you'll be reading these data pictures like a true expert!
Keep learning, free
Create a free Syllabax account to unlock practice questions and games for this topic.
Visual Learning Enhanced! 🚀
To help you master this topic, we use Advanced Syllabax AI to generate detailed diagrams and visual models.
Note on Visuals: The AI sometimes makes spelling errors in image labels. Please refer to the lesson text for the correct terminology.