Learning Journey
Watch this topic in 60 seconds
Free preview · Lesson 1
Understanding Making Picture Graphs
Making Picture Graphs: Drawing Data with Pictures!
Have you ever tried to tell a story using only pictures? It can be a lot of fun, and it's also a great way to share information! That's exactly what a picture graph does. It helps us see and understand numbers by using simple drawings instead of just long lists of words or numbers.
What is a Picture Graph?
A picture graph is a special kind of graph that uses pictures or symbols to show how much of something there is. Instead of writing "red apples: 5," you might draw 5 little apple pictures.
Imagine you have a big collection of toy cars. Instead of writing down "red cars: 10, blue cars: 5, green cars: 7," you could draw 10 little red car pictures, 5 little blue car pictures, and 7 little green car pictures. This makes it super easy to see which color car you have the most of, and which you have the least of, just by looking at the pictures!
The Special Parts of a Picture Graph
Just like a good story needs a title and characters, a good picture graph needs a few important parts to make sense:
1. The Title
The title tells you what the entire graph is about. It's like the name on the cover of a book – it gives you a quick idea of what story you're about to "read" with the pictures. For example, a title might be "Our Class's Favorite Animals" or "Number of Books Read This Month."
2. Labels or Categories
These are the different "groups" or "things" you are counting. If you're counting favorite colors, the labels would be "Red," "Blue," "Green," and so on. They are like the different shelves in a toy store, each for a different kind of toy.
3. The Pictures or Symbols
These are the actual drawings you use to show the amount of each category. If you're counting students' favorite fruits, you might draw little pictures of apples, bananas, or oranges. Each picture is like a little token representing something you counted.
4. The Key (The Secret Code Breaker!)
This is probably the most important part of a picture graph! The key tells you what each single picture stands for. Does one apple picture mean 1 apple, or 2 apples, or maybe even 5 apples?
Think of the key like a secret code. If your picture graph uses a star symbol, the key might say: "Each  means 3 students." Without the key, you wouldn't know if one star means 1 student or 100 students! It's the decoder ring for your secret message, making sure everyone understands the pictures correctly.
Here's an example of some raw data we might want to graph:
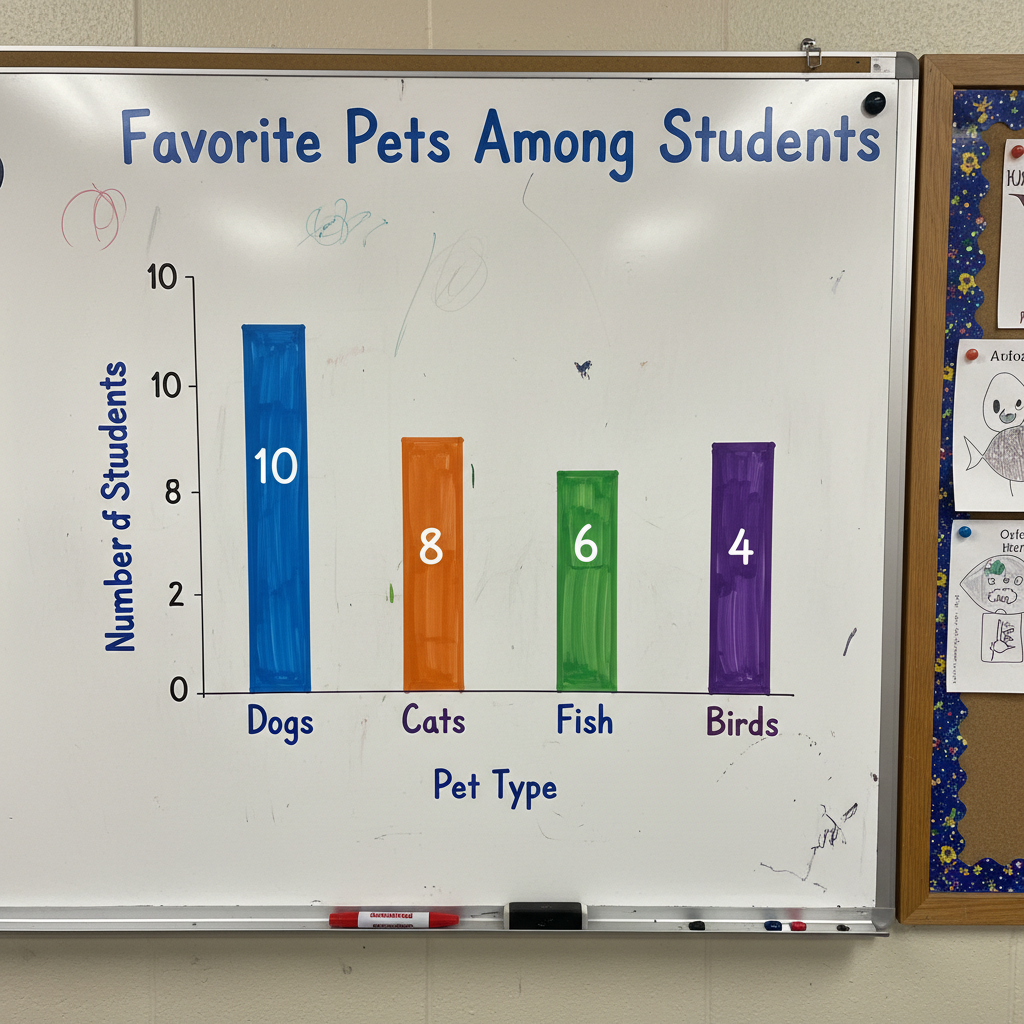
In this example, we have the categories (Dogs, Cats, Fish, Birds) and the numbers for each. Now, how do we turn this into a picture graph?
How to Make Your Own Picture Graph!
Let's make a picture graph together using a simple example. Imagine we counted the number of different colored pencils in your pencil case:
- Red Pencils: 6
- Blue Pencils: 4
- Green Pencils: 8
- Yellow Pencils: 2
Step 1: Collect Your Data!
First, you need to know what you're counting and how many of each you have. (We already did this with our colored pencils: Red: 6, Blue: 4, Green: 8, Yellow: 2).
Step 2: Choose a Title.
What is your graph about? Let's call ours: "Colored Pencils in My Case."
Step 3: List Your Categories.
These are the different things you counted. For us, it's Red, Blue, Green, Yellow.
Step 4: Pick a Picture/Symbol.
Choose a simple picture that makes sense for your data. Since we're counting pencils, a little pencil drawing would be perfect!  ⚠️ This picture may have spelling mistakes. Trust the words in the lesson.
Step 5: Decide on Your Key (The Most Important Step!)
This is where you decide how many items each single picture will represent. If you have a lot of items (like 20 cookies), drawing 20 tiny cookies takes a long time! What if one cookie drawing meant 5 actual cookies? Then you'd only draw 4 cookie pictures for 20 cookies (because 4 x 5 = 20).
For our pencils (Red: 6, Blue: 4, Green: 8, Yellow: 2), all these numbers are even. So, a good key would be: "1 = 2 pencils." This makes it easier to draw fewer pictures!
- Red (6 pencils): 6 divided by 2 = 3 pencil pictures.
- Blue (4 pencils): 4 divided by 2 = 2 pencil pictures.
- Green (8 pencils): 8 divided by 2 = 4 pencil pictures.
- Yellow (2 pencils): 2 divided by 2 = 1 pencil picture.
Step 6: Draw Your Pictures!
Carefully draw the correct number of pictures for each category, using your key. Make sure they are neat and lined up so it's easy to count and compare!
This image shows a finished picture graph. Notice how easy it is to see which color is most popular just by looking at the rows of stars!
Why are Picture Graphs Super Helpful?
Picture graphs are amazing because they:
- Make information easy to see: You can quickly look at the pictures and understand the data.
- Help you compare: It's super easy to see which category has the most, which has the least, or how many more one has than another.
- Tell a story with pictures: They make numbers fun and understandable, even for big groups of data!
Let's Remember!
Whenever you see or make a picture graph, always look for or include these four important parts: a clear Title, well-defined Categories/Labels, simple Pictures/Symbols, and most importantly, a clear Key to unlock the meaning of your pictures! With these tools, you're a data-drawing superstar!
Keep learning, free
Create a free Syllabax account to unlock practice questions and games for this topic.
Visual Learning Enhanced! 🚀
To help you master this topic, we use Advanced Syllabax AI to generate detailed diagrams and visual models.
Note on Visuals: The AI sometimes makes spelling errors in image labels. Please refer to the lesson text for the correct terminology.