Learning Journey
Watch this topic in 60 seconds
Free preview · Lesson 1
Understanding Understanding Variance (Conceptual)
Understanding Variance: The Story of How Spread Out Data Is
Imagine you're trying to describe a group of numbers, like test scores in a class, daily temperatures, or heights of students. You've probably heard of the average (or mean) – it tells you the typical value. But what if two groups have the same average, yet they feel completely different? This is where variance steps in! Variance is a powerful concept in statistics that helps us understand the spread or dispersion of data points.
Beyond the Average: Why Spread Matters
Think about it: knowing the average tells you where the center is, but it doesn't tell you how clustered or scattered the individual data points are around that center. For instance, if you know the average temperature for a week was 20°C, does that mean it was a steady 20°C every day, or did it swing wildly from 10°C one day to 30°C the next? The average alone can't tell you this. Variance fills that gap by giving us a numerical way to measure this 'spread'.
Analogy 1: The Basketball Teams
Imagine two basketball teams, the "Steady Shooters" and the "Wild Wonders." Over 10 games, both teams averaged 100 points per game. Sounds identical, right?
- The Steady Shooters consistently scored between 95 and 105 points in every game. They were predictable and reliable.
- The Wild Wonders, however, had games where they scored a whopping 150 points, and other games where they barely scraped by with 50 points. Their scores were all over the place.
Even though their average (mean) score was the same, their performance was vastly different! The Steady Shooters had low variance in their scores because their points were clustered close to the average. The Wild Wonders had high variance because their scores were spread out far from the average.
What Exactly is Variance?
At its core, variance is a measure of how far each number in a dataset is from the mean (average), and thus from every other number in the dataset. It helps us understand the typical distance of data points from the center. A small variance indicates that data points tend to be very close to the mean and each other, while a large variance indicates that data points are spread out over a wider range.
Analogy 2: The Cookie Batch
Think about baking cookies. You have two different recipes for chocolate chip cookies.
- Recipe A always produces cookies that are almost perfectly 3 inches in diameter. They are very uniform.
- Recipe B sometimes makes tiny 1-inch cookies, sometimes giant 5-inch cookies, and everything in between.
If the average size for both recipes turns out to be 3 inches, which recipe would you say is more consistent? Recipe A, of course! Recipe A has a low variance in cookie size, while Recipe B has a high variance. Variance tells us about this consistency or lack thereof.
Measuring the "Distance" from the Average
To calculate variance (conceptually, we're not doing the math here!), we essentially look at how far each individual data point 'deviates' or 'differs' from the average. If a number is far from the average, it contributes more to the variance. If it's close to the average, it contributes less.
Why do we care about the "squared differences" when we talk about variance? Imagine you're measuring how far people live from a city center. Some live 5 miles north (+5), some 5 miles south (-5). If you just added up these distances, they'd cancel each other out, making it seem like everyone lives at the center! To avoid this, we square these differences. Squaring ensures that all distances become positive (e.g., -5 squared is 25, +5 squared is also 25) and also gives more weight to points that are much further away. So, variance is like finding the "average of these squared distances" from the mean.
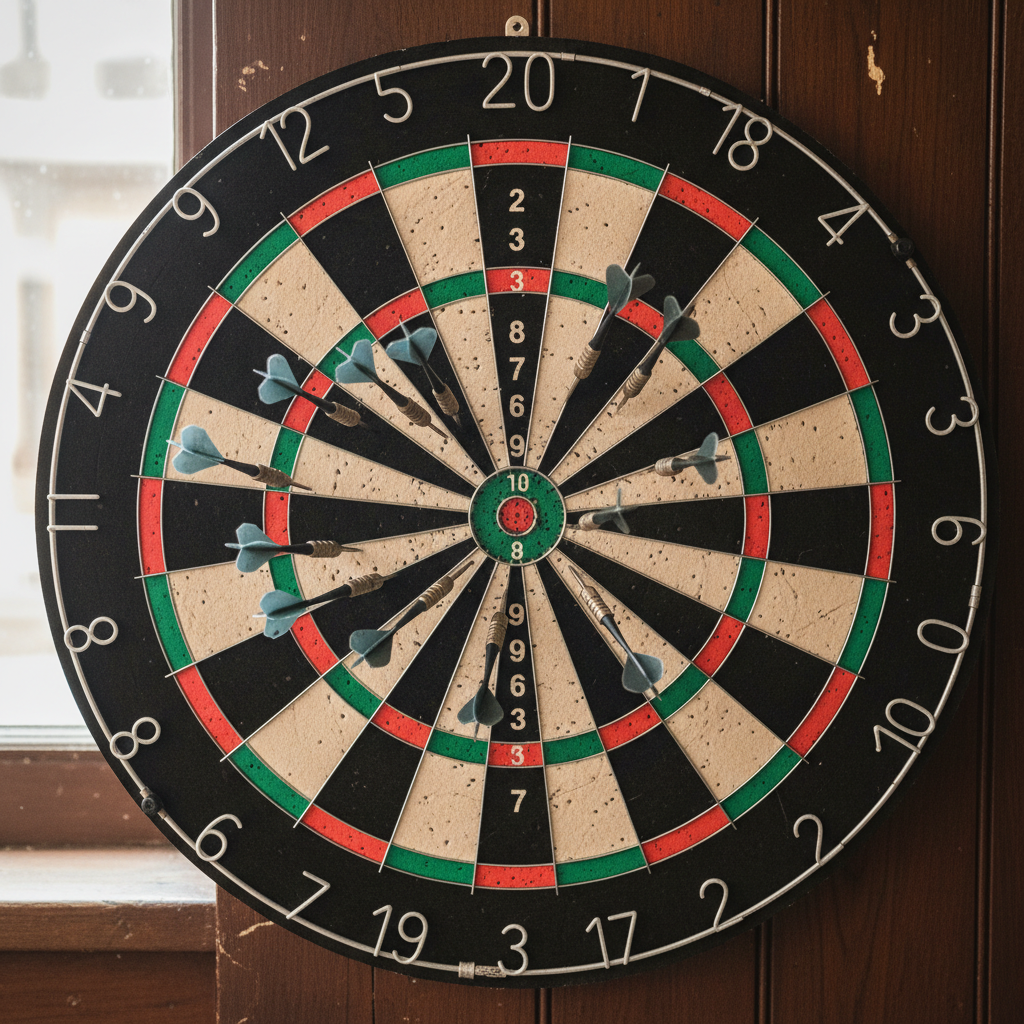
Analogy 3: Target Practice
Imagine two archers, Alice and Bob, practicing their target shooting. The bullseye is their target (like the mean).
- Alice shoots ten arrows, and all of them land very close to the bullseye, maybe a little to the left or right, but always in the inner rings. Her shots are consistent and accurate. Her shots have low variance.
- Bob also shoots ten arrows. Some hit the bullseye, some miss the target completely, some land in the outer rings. His shots are much less consistent. His shots have high variance.
Even if, by some chance, the 'average' distance of their shots from the bullseye was similar using a different measure, variance would clearly show that Alice's shots are much more grouped and predictable than Bob's.
High Variance vs. Low Variance: What Do They Tell Us?
- High Variance: This means the data points are very spread out from the average. There's a lot of variability or inconsistency in the data. If you're looking at daily temperatures, high variance would mean extreme hot and cold days, making the weather unpredictable. If it's stock prices, high variance suggests a volatile, risky stock.
- Low Variance: This means the data points are tightly clustered around the average. There's little variability, suggesting consistency and predictability. For temperatures, low variance means stable, moderate weather. For stock prices, low variance suggests a stable, less risky investment.
Analogy 4: The Commute to School
Consider your commute time to school each morning.
- If your commute is usually 15 minutes, and it's almost always between 14 and 16 minutes, you have low variance in your commute time. It's very predictable.
- If your commute is sometimes 5 minutes (on a clear day) and sometimes 45 minutes (when there's traffic or an accident), but the average is still 15 minutes, you have high variance. You can't rely on that average; the actual time could be very different from day to day.
Variance helps you understand this reliability and consistency.
Why is Variance Important? (Real-World Applications)
- Quality Control: In manufacturing, a low variance in product dimensions means consistent quality. A high variance would mean some products are too big, some too small – leading to defects.
- Finance and Investing: Investors look at the variance of stock prices. A stock with high variance is considered more volatile and risky, even if its average return is high. A low-variance stock is more stable.
- Science and Research: Scientists use variance to understand the spread of results in experiments. If results have low variance, it suggests a more reliable and repeatable experiment.
- Sports Analysis: Coaches might analyze the variance in a player's performance. A player with low variance is consistently good, while high variance might mean they have amazing days and terrible days.
Variance vs. Range: A Quick Distinction
You might be thinking, "Can't I just use the range (the difference between the highest and lowest values) to measure spread?" While the range does tell you some spread, variance is a much more robust and informative measure. The range only considers the two extreme points and ignores everything in between. Variance, on the other hand, takes into account every single data point and its distance from the mean, giving a much more complete picture of the overall spread. It's like judging a book by its cover (range) versus reading the whole story (variance).
Wrapping Up: The Story of Spread
Variance is a fundamental concept that goes beyond simply knowing the average. It helps us paint a full picture of our data, telling us not just where the center is, but also how much the data points scatter or cluster around that center. Whether you're comparing cookie recipes, evaluating stock market risks, or understanding consistency in performance, variance is your go-to tool for understanding the "spread" of information. It gives us valuable insights into consistency, predictability, and variability in the world around us.
Keep learning, free
Create a free Syllabax account to unlock practice questions and games for this topic.
Visual Learning Enhanced! 🚀
To help you master this topic, we use Advanced Syllabax AI to generate detailed diagrams and visual models.
Note on Visuals: The AI sometimes makes spelling errors in image labels. Please refer to the lesson text for the correct terminology.