Scatter Plots and Trend Lines
Watch this topic in 60 seconds
Free preview · Lesson 1
Understanding Scatter Plots and Trend Lines
Unlocking Data Stories: A Guide to Scatter Plots and Trend Lines
Welcome, 10th-grade data detectives! In our world, information is everywhere. From how much you study to your test scores, or how much a product costs versus how many people buy it – data points often have hidden relationships. Today, we're going to learn how to uncover these relationships using two powerful tools: Scatter Plots and Trend Lines.
What is a Scatter Plot? Your Data's "Star Map"
Imagine you're looking up at the night sky. Each star is a unique point, but when you connect some of them, you see constellations – patterns! A scatter plot is very much like a star map for your data. It's a graph that shows the relationship between two different numerical variables.
Analogy: Height vs. Shoe Size
Let's say you measure the height and shoe size of everyone in your class. For each person, you'd get two numbers: their height (e.g., 160 cm) and their shoe size (e.g., US size 7). A scatter plot takes these pairs of numbers and puts them on a graph. One axis (usually the horizontal one, called the x-axis) might represent height, and the other axis (the vertical one, the y-axis) might represent shoe size. Each student becomes one dot on this graph.
The goal of a scatter plot is to visually see if there's a pattern or connection between these two variables. Do taller people tend to have larger shoe sizes? A scatter plot helps us answer questions like that!
Decoding Relationships: Types of Correlation
Once you've plotted your data, you'll start to notice how the dots are arranged. This arrangement tells us about the correlation, which is just a fancy word for the type of relationship between the two variables. There are three main types:
1. Positive Correlation: "As one goes up, so does the other!"
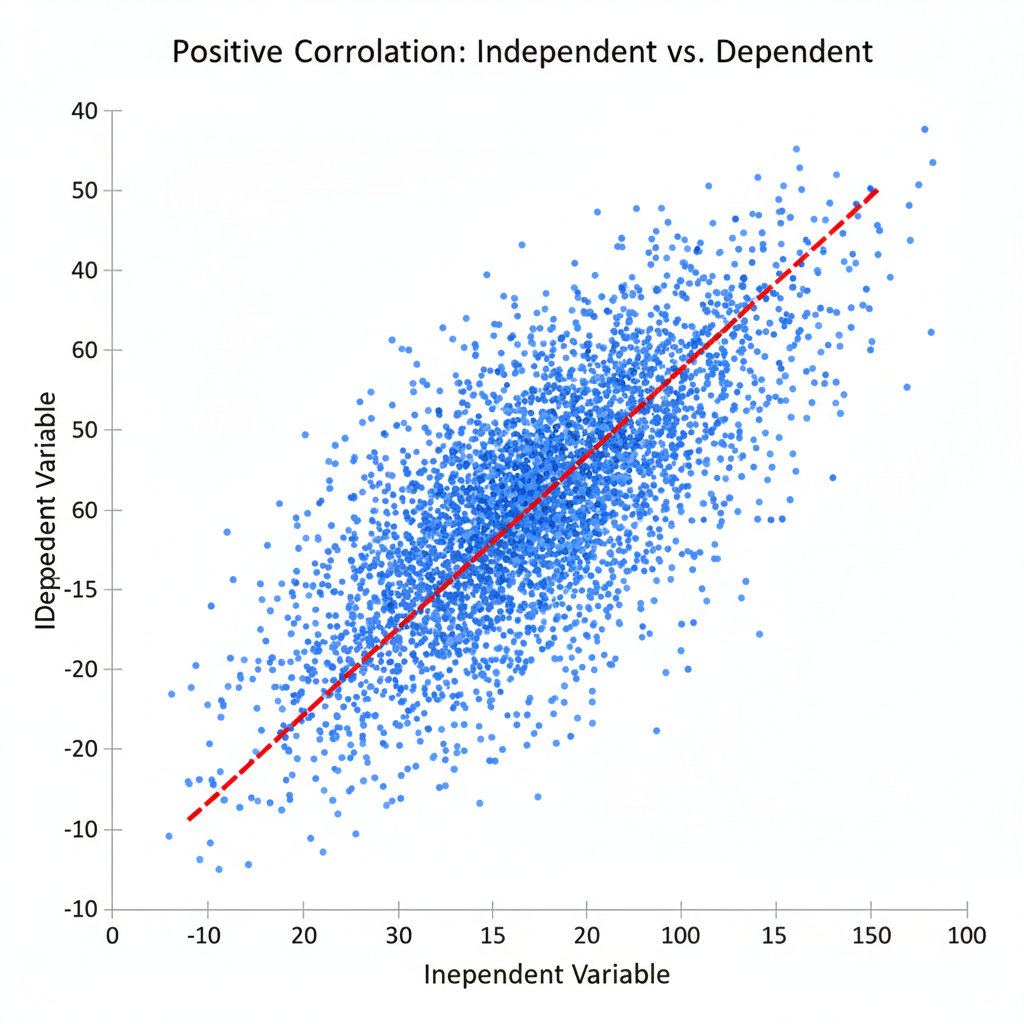
When you look at your scatter plot and the dots generally seem to go upwards from left to right, like climbing a hill, you have a positive correlation. This means that as one variable increases, the other variable also tends to increase.
Analogy: Study Time and Test Scores
Think about how much you study for a test and the score you get. Generally, the more hours you spend studying (variable 1), the higher your test score tends to be (variable 2). If you plotted this data, you'd see the points mostly moving upwards. Another example: The more ice cream sold, the higher the temperature.
2. Negative Correlation: "As one goes up, the other goes down!"
If your dots generally seem to go downwards from left to right, like sliding down a hill, you have a negative correlation. This means that as one variable increases, the other variable tends to decrease.
Analogy: Phone Usage and Battery Life
Consider the number of hours you spend using your phone (variable 1) and the percentage of battery life remaining (variable 2). As your screen time goes up, your battery life goes down. If you plotted this, the dots would generally trend downwards. Another example: The higher the price of a popular video game, the fewer copies are typically sold.
3. No Correlation: "No clear connection!"
Sometimes, the dots on your scatter plot look like a random cloud, with no clear uphill or downhill pattern. This indicates no correlation. It means there's no obvious relationship or connection between the two variables.
Analogy: Your Shoe Size and Your IQ
Does the size of your shoes (variable 1) have anything to do with how smart you are (variable 2)? Absolutely not! If you plotted this data, the points would be scattered all over the place, showing no discernible pattern. Another example: The number of pets someone owns and their favorite color.
Introducing the Trend Line: Finding the "Main Path"
Once you've seen the general direction of your data points (if any), you can draw a special line called a trend line, also known as the line of best fit. This line is like drawing an arrow through your constellation to show its main direction. It's a straight line that best represents the overall trend of the data on a scatter plot.
Analogy: Drawing a Path Through a Crowd
Imagine you're at a very crowded concert, and everyone is slowly moving in a general direction towards the stage. Even though people are weaving around and not walking in a perfectly straight line, you could draw a single straight line on a map that best shows the overall path of the crowd. That's what a trend line does for your data points – it summarizes their general movement.
The trend line doesn't have to hit every single data point. Its job is to be a good average representation of all the points. When drawing it by hand, you try to place it so that roughly an equal number of points are above and below the line.
 ⚠️ This picture may have spelling mistakes. Trust the words in the lesson.
Why Are Trend Lines Useful? Making Predictions!
Trend lines aren't just for summarizing; they're also fantastic for making educated guesses or predictions about new data. Once you have a trend line, you can use it to estimate values that weren't originally in your data set.
Analogy: Predicting Future Weather
If you've been tracking the temperature and the number of popsicles sold each day, and you've drawn a trend line (likely positive correlation), you could use that line to predict how many popsicles might sell on a day when the temperature is, say, 35 degrees Celsius, even if you don't have exact data for 35 degrees.
Strength of Correlation: How Clingy are the Dots?
Beyond just knowing the direction (positive, negative, or none), we can also describe the strength of the correlation. This refers to how closely the data points hug the trend line.
- Strong Correlation: The data points are very close to the trend line. They follow the pattern very tightly, like a perfectly straight line of ducks in a row. This means the relationship is very clear and predictable.
- Weak Correlation: The data points are more spread out and don't stick very close to the trend line. They still show a general direction, but there's a lot more variation, like ducks waddling in the general direction but not in a perfect line. This means the relationship is less clear or less predictable.
- No Correlation: The points are all over the place, and a trend line wouldn't make much sense at all.
Putting It All Together: Why This Matters
Scatter plots and trend lines are fundamental tools in many fields. Scientists use them to find relationships between variables in experiments. Businesses use them to understand customer behavior or predict sales. Economists use them to analyze market trends. Even in sports, they can be used to see if more practice hours lead to better game performance.
By learning to interpret these simple yet powerful graphs, you're gaining a valuable skill to make sense of the data that surrounds you every day!
Keep learning, free
Create a free Syllabax account to unlock practice questions and games for this topic.
Visual Learning Enhanced! 🚀
To help you master this topic, we use Advanced Syllabax AI to generate detailed diagrams and visual models.
Note on Visuals: The AI sometimes makes spelling errors in image labels. Please refer to the lesson text for the correct terminology.